Fig. 5
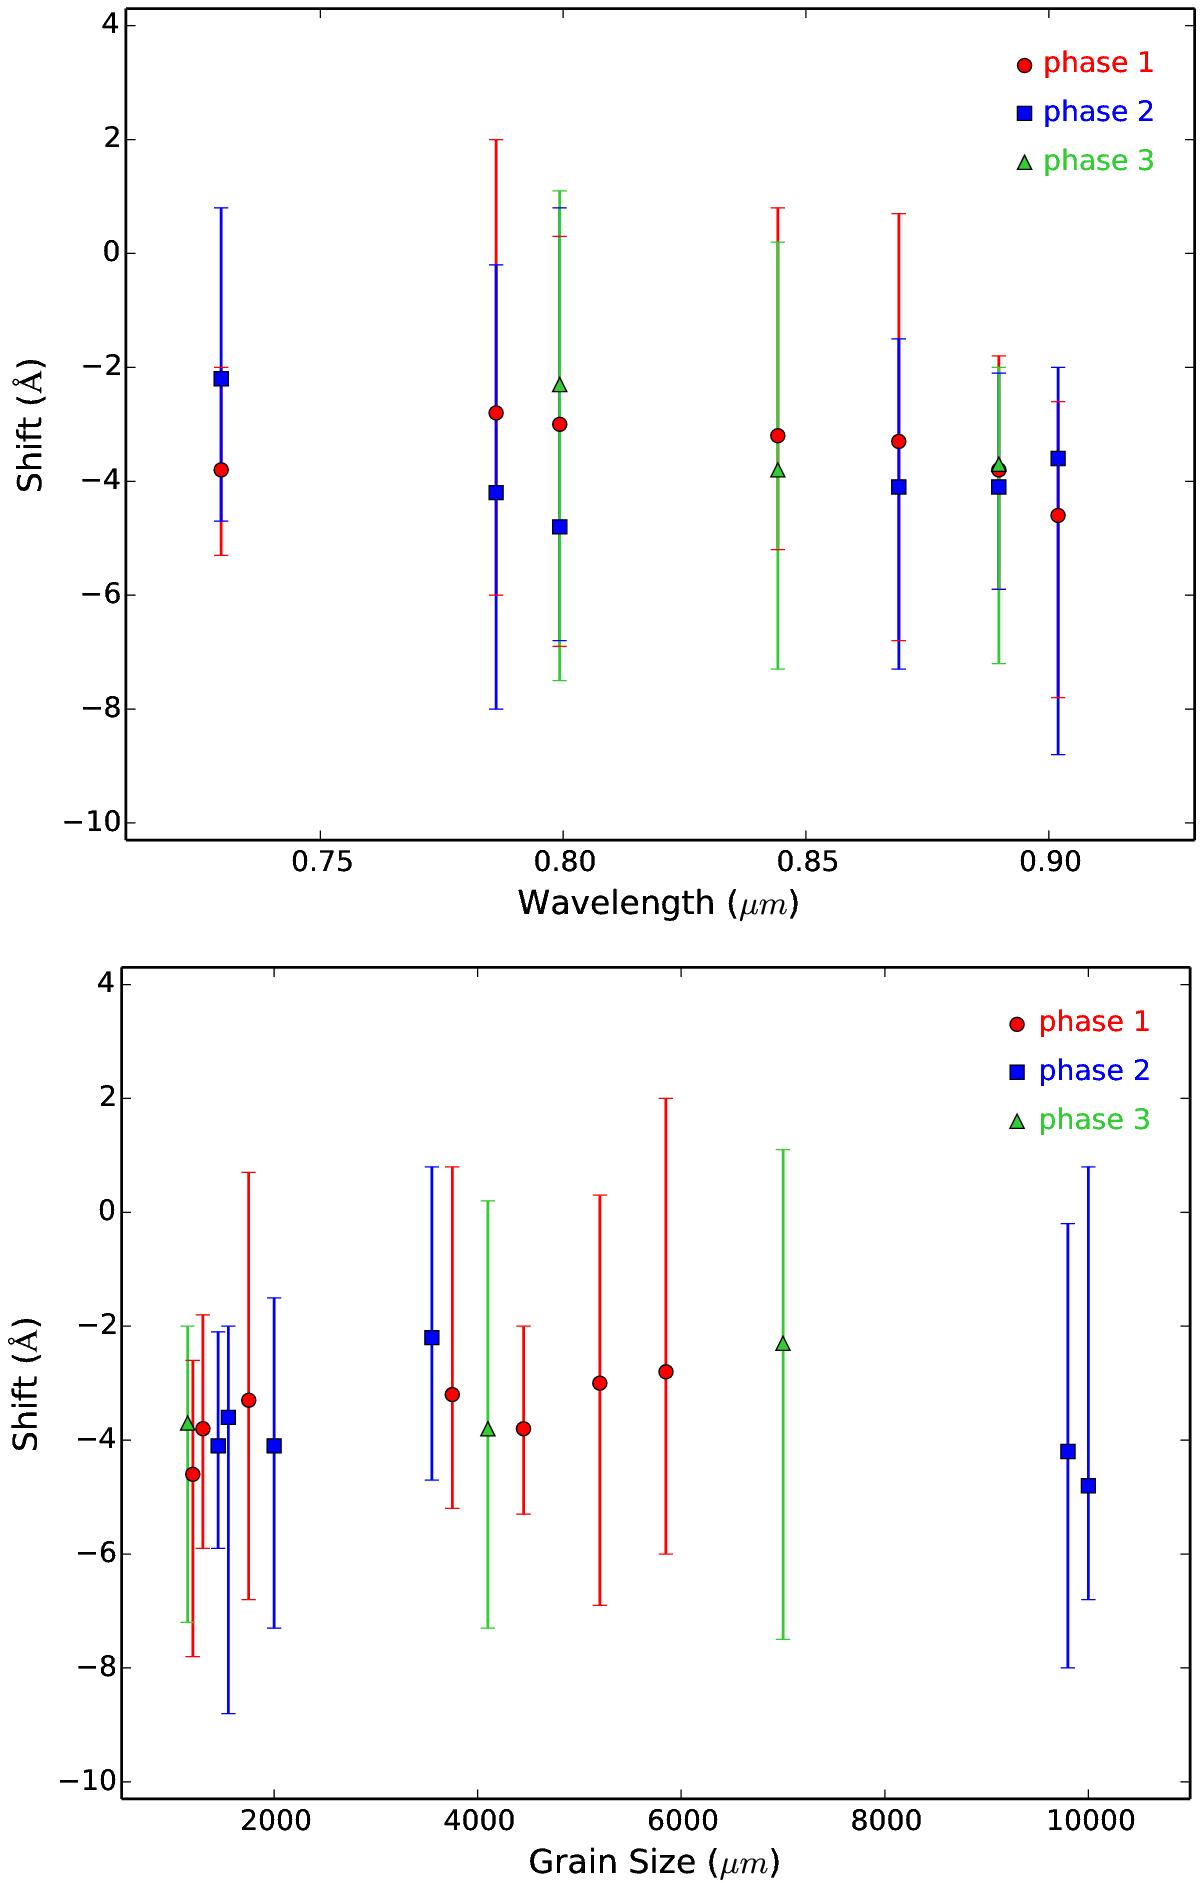
Top panel: shifts of the center of each methane-ice band for the three phases. Bottom panel: shifts of the center of the bands and the corresponding size of grain, given by the model fit, for the three phases. In both panels, the red circles correspond to phase 1, the blue squares to phase 2, and the green triangles to phase 3.
Current usage metrics show cumulative count of Article Views (full-text article views including HTML views, PDF and ePub downloads, according to the available data) and Abstracts Views on Vision4Press platform.
Data correspond to usage on the plateform after 2015. The current usage metrics is available 48-96 hours after online publication and is updated daily on week days.
Initial download of the metrics may take a while.