Fig. 4
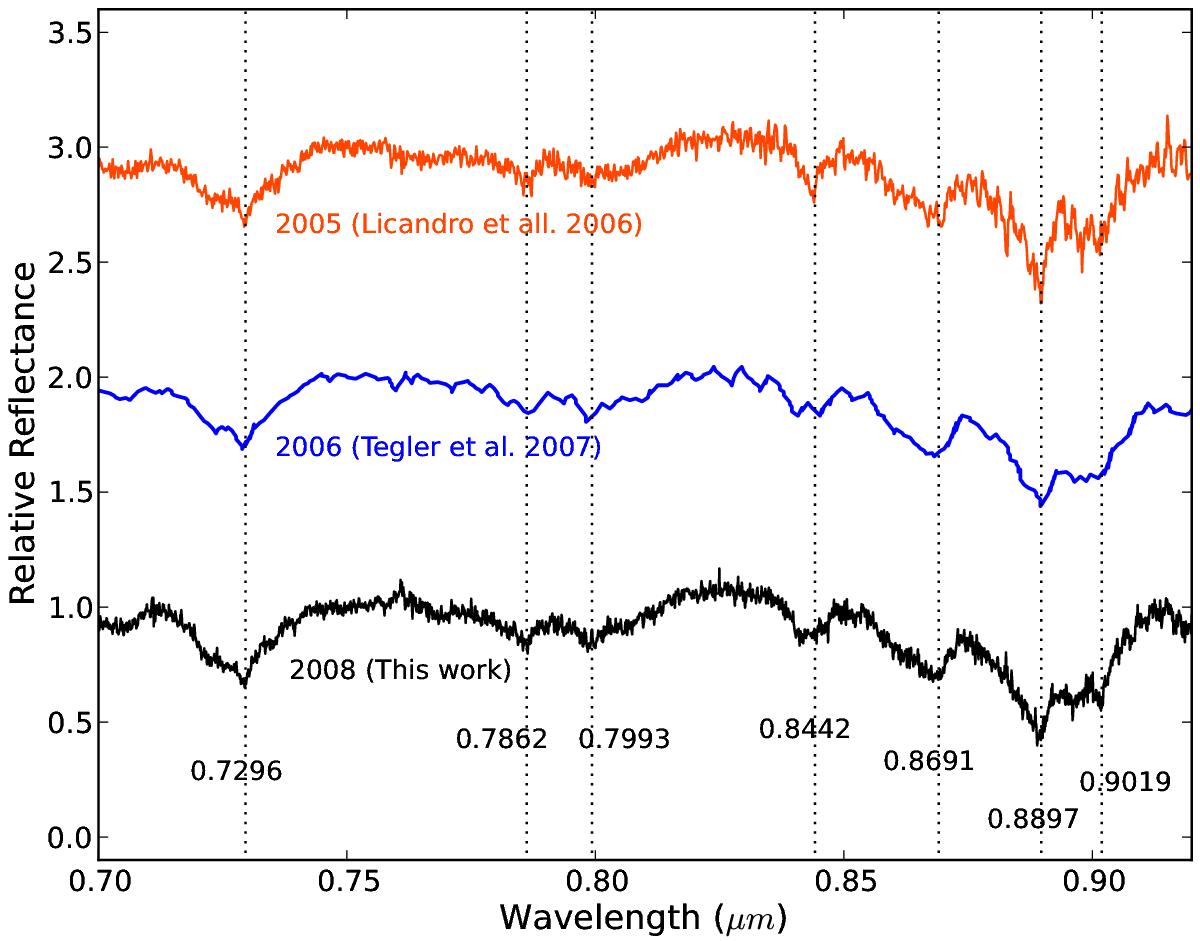
Comparison of the spectra of Makemake from the literature in the 0.70 − 0.92μm range. From top to bottom: in orange, the spectrum from Licandro et al. (2006b) taken in 2005; in blue the spectrum from Tegler et al. (2007) taken in 2006; in black the spectrum corresponding to phase 1 from this work taken in 2008. All the spectra are normalized at 0.75 μm and shifted by 1.0 in relative reflectance for clarity. The dotted lines denote the center of the absorption bands of pure methane ice.
Current usage metrics show cumulative count of Article Views (full-text article views including HTML views, PDF and ePub downloads, according to the available data) and Abstracts Views on Vision4Press platform.
Data correspond to usage on the plateform after 2015. The current usage metrics is available 48-96 hours after online publication and is updated daily on week days.
Initial download of the metrics may take a while.