Free Access
Fig. 2
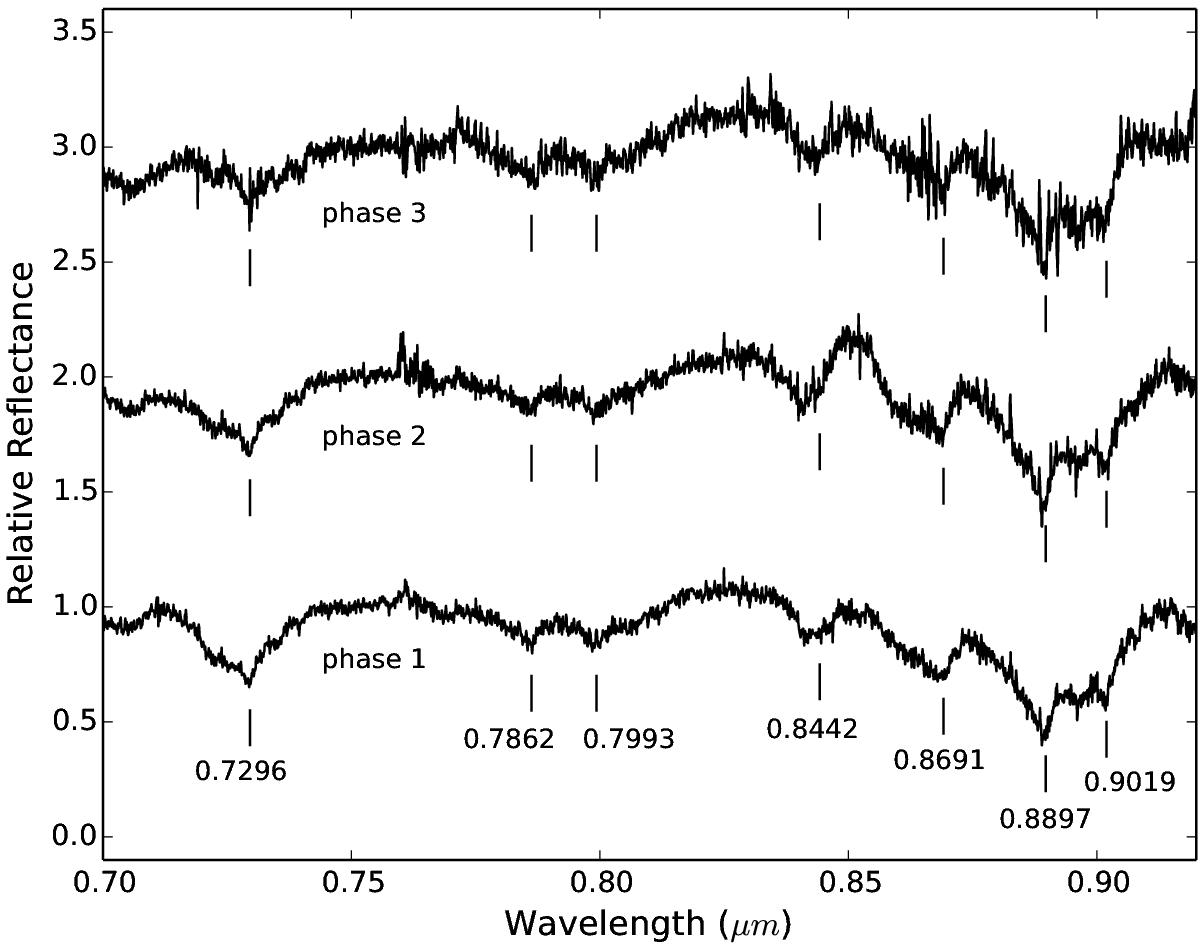
Red part of the three spectra corresponding, from bottom to top, to phases 1, 2, and 3, normalized at 0.75 μm and shifted by 1.0 in relative reflectance for clarity. For the three spectra, the center of absorption bands of pure methane ice are marked.
Current usage metrics show cumulative count of Article Views (full-text article views including HTML views, PDF and ePub downloads, according to the available data) and Abstracts Views on Vision4Press platform.
Data correspond to usage on the plateform after 2015. The current usage metrics is available 48-96 hours after online publication and is updated daily on week days.
Initial download of the metrics may take a while.