Fig. 7
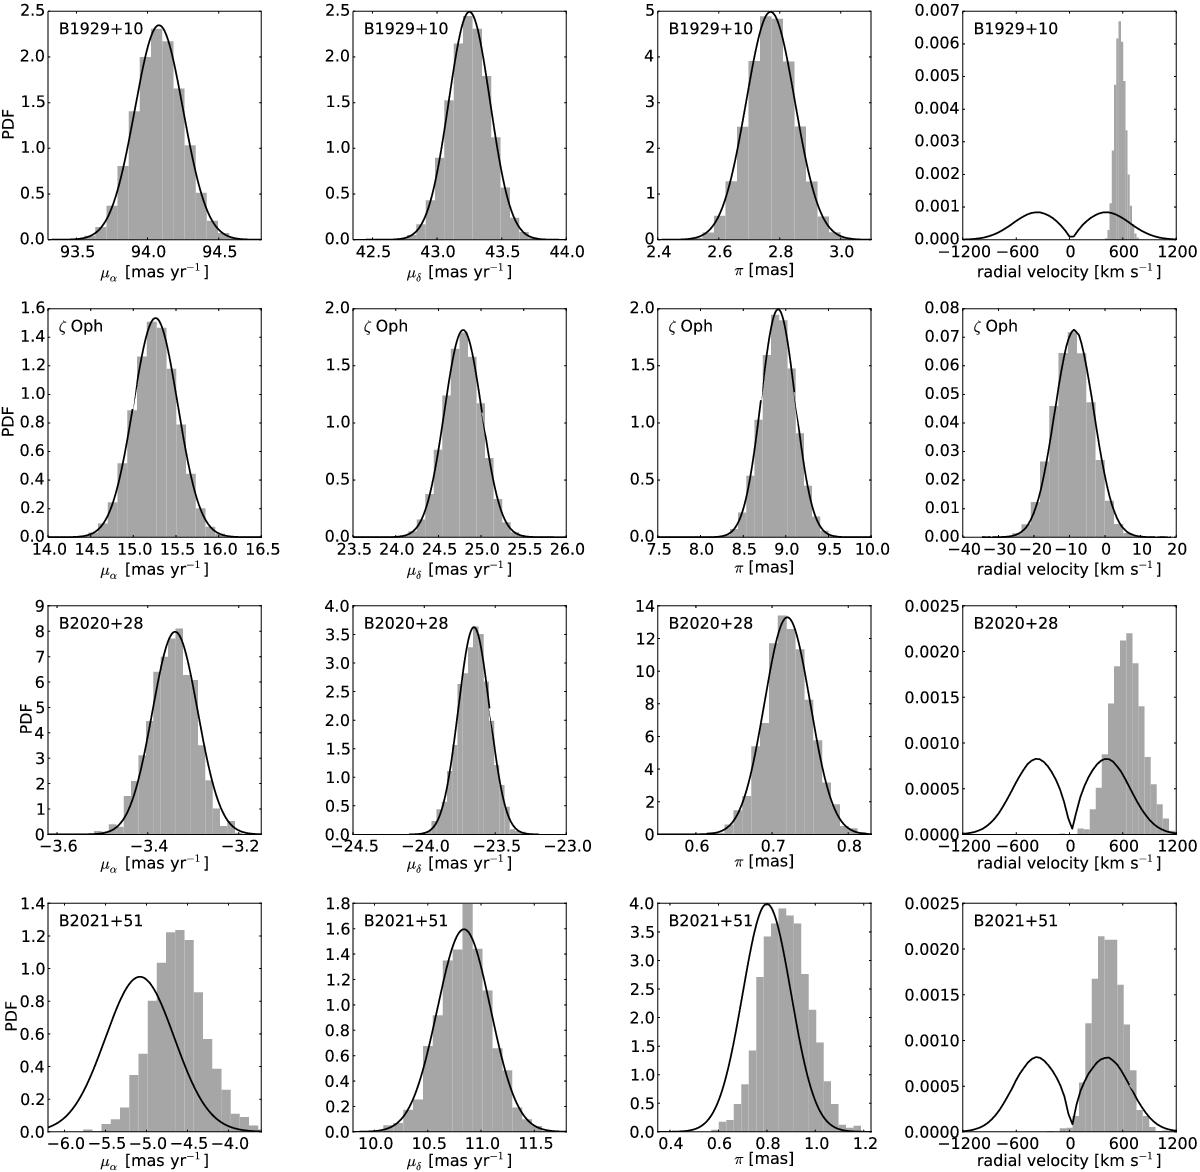
Probability density function (grey histograms) of astrometric parameters and required radial velocities that result in a minimum separation of less than 10 pc between B1929+10/ζ Oph and B2020+28/B2021+51. Columns from left to right show the results for μα,μδ,π,and Vrad. For the measured parameters μα,μδ, andπ, the solid lines indicate the input parameter distributions derived from assuming Gaussian errors. The solid line in the last column indicates the input distribution for Vrad as derived from our measured transverse velocity and the empirically determined space velocity distribution derived by Hobbs et al. (2005). Objects from top to bottom are B1929+10, ζ Oph, B2020+28, and B2021+51.
Current usage metrics show cumulative count of Article Views (full-text article views including HTML views, PDF and ePub downloads, according to the available data) and Abstracts Views on Vision4Press platform.
Data correspond to usage on the plateform after 2015. The current usage metrics is available 48-96 hours after online publication and is updated daily on week days.
Initial download of the metrics may take a while.