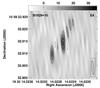
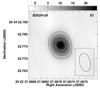
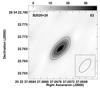
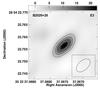
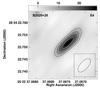
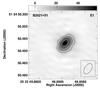
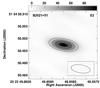
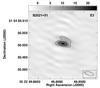
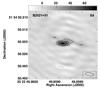
Fig. 2
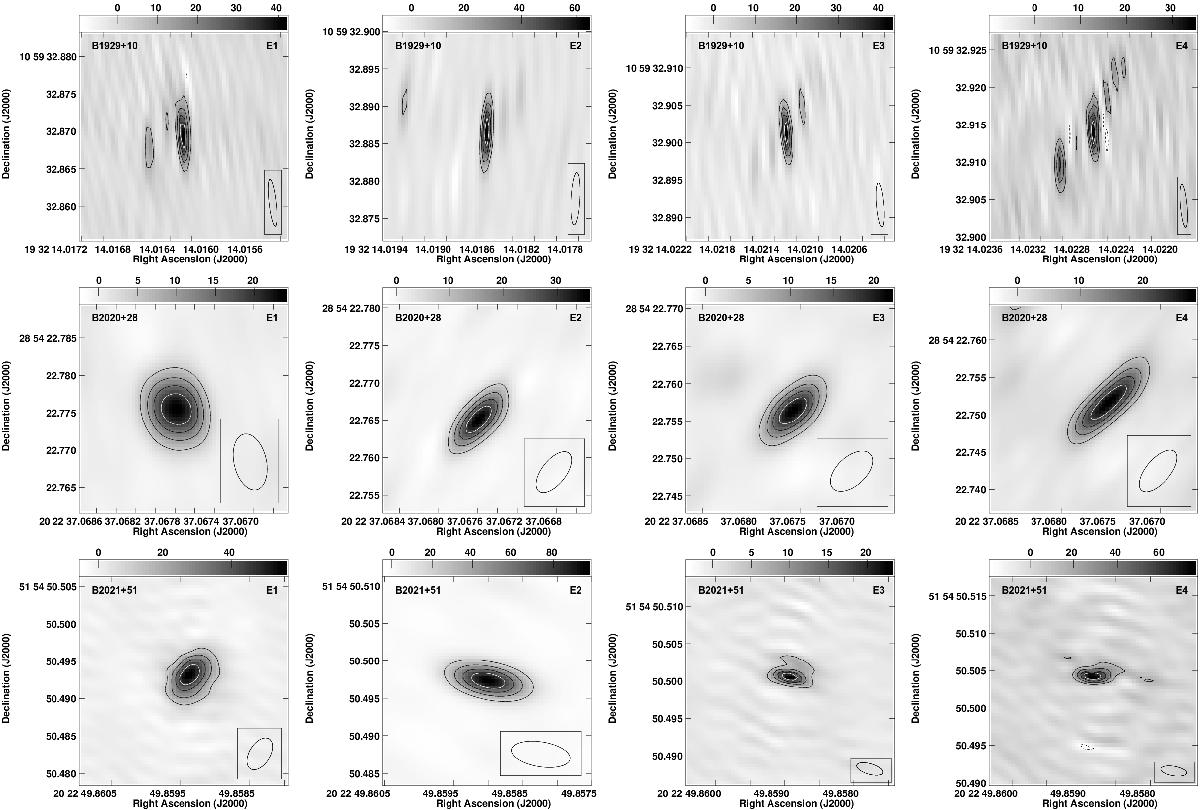
Greyscale plots of the fitted pulsar images. Rows from top to bottom show B1929+10, B2020+28, and B2021+51. Columns from left to right correspond to epochs one to four. Overlaid contours increase in steps of 20 percent of the peak flux density, where negative values are indicated by dashed contours. The absolute flux density scale (mJybeam-1) is indicated above each individual panel, and the beam size and position angle are indicated in the bottom right. The larger beam sizes for B2020+28 and B2021+51 compared to that of B1929+10 are due to flagging of baselines to Sh and/or Ur.
Current usage metrics show cumulative count of Article Views (full-text article views including HTML views, PDF and ePub downloads, according to the available data) and Abstracts Views on Vision4Press platform.
Data correspond to usage on the plateform after 2015. The current usage metrics is available 48-96 hours after online publication and is updated daily on week days.
Initial download of the metrics may take a while.