Free Access
Fig. 3
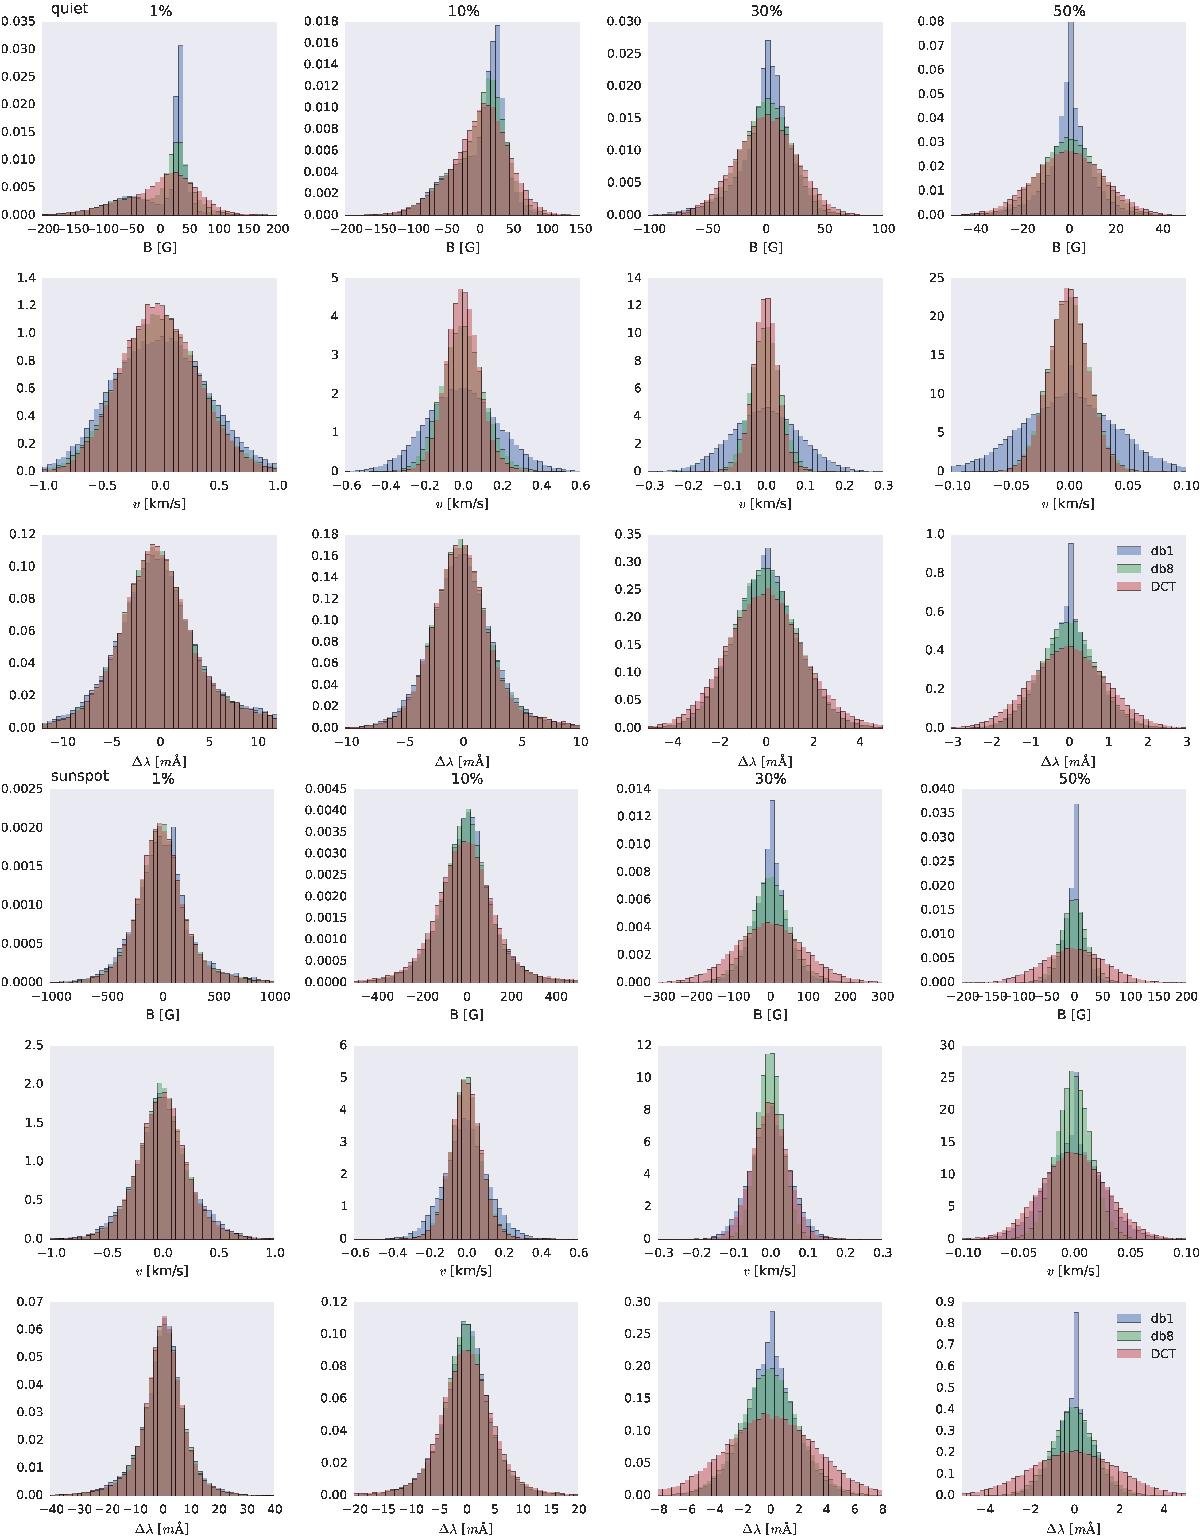
Histograms of the difference between the original and compressed parameters at different levels (indicated in each column). Upper panels: results for the quiet Sun map, while the lower panels refer to the sunspot data. Each histogram refers to a different linear transformation.
This figure is made of several images, please see below:
Current usage metrics show cumulative count of Article Views (full-text article views including HTML views, PDF and ePub downloads, according to the available data) and Abstracts Views on Vision4Press platform.
Data correspond to usage on the plateform after 2015. The current usage metrics is available 48-96 hours after online publication and is updated daily on week days.
Initial download of the metrics may take a while.