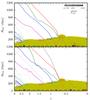
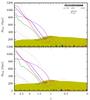
Fig. 6

Merger history of G1 (left-hand panels) and G2 (right-hand panels) for simulations CS (upper panels) and MA (lower panels), alongside the evolution of its statistics. The plots show the comoving distance of each satellite from the position of G1/G2 as a function of redshift, where coloured lines indicate the major (>30%) and intermediate mass (between 5 and 30%) mergers (see Table 2). The greyscales indicate minor mergers, the tone representing ![]() , the stellar mass of the progenitor as a fraction of the stellar mass of the galaxy at the time of first infall into the corresponding R200 (see Sect. 4 of the main text for full details). The shaded region indicates R200 of G1/G2, whilst the black horizontal dashed line indicates a radius 30 ckpc, a cut which encompasses the baryonic component of the galaxy. The dotted lines follow the positions of the major progenitors after first infall within the R200 until subfind can no longer identify them as distinct objects.
, the stellar mass of the progenitor as a fraction of the stellar mass of the galaxy at the time of first infall into the corresponding R200 (see Sect. 4 of the main text for full details). The shaded region indicates R200 of G1/G2, whilst the black horizontal dashed line indicates a radius 30 ckpc, a cut which encompasses the baryonic component of the galaxy. The dotted lines follow the positions of the major progenitors after first infall within the R200 until subfind can no longer identify them as distinct objects.
Current usage metrics show cumulative count of Article Views (full-text article views including HTML views, PDF and ePub downloads, according to the available data) and Abstracts Views on Vision4Press platform.
Data correspond to usage on the plateform after 2015. The current usage metrics is available 48-96 hours after online publication and is updated daily on week days.
Initial download of the metrics may take a while.