Fig. 2
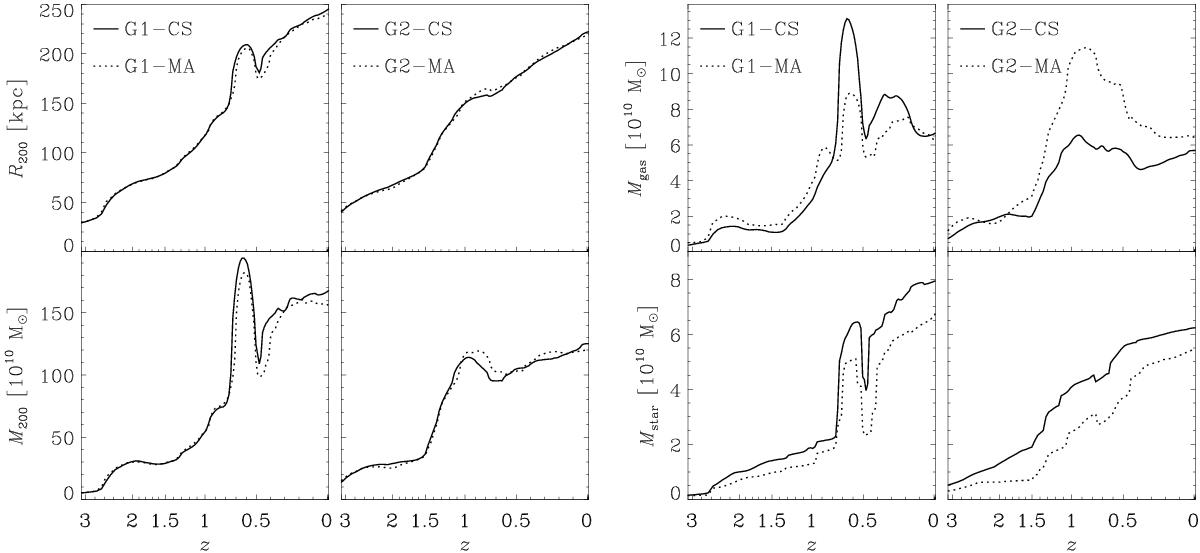
Size/mass evolution of G1 (solid line) and G2 (dashed line) as a function of redshift. We show the evolution of R200 (upper-left panels), the total mass (M200, lower-left panels), the gas mass (Mgas, upper-right panels) and the stellar mass (Mstar, lower-right panels), all within R200. For G1, the peak seen in all panels at z ≈ 0.65 is owing to the emergence of two large objects within R200 (see further discussion in Sect. 4).
Current usage metrics show cumulative count of Article Views (full-text article views including HTML views, PDF and ePub downloads, according to the available data) and Abstracts Views on Vision4Press platform.
Data correspond to usage on the plateform after 2015. The current usage metrics is available 48-96 hours after online publication and is updated daily on week days.
Initial download of the metrics may take a while.