Fig. 8
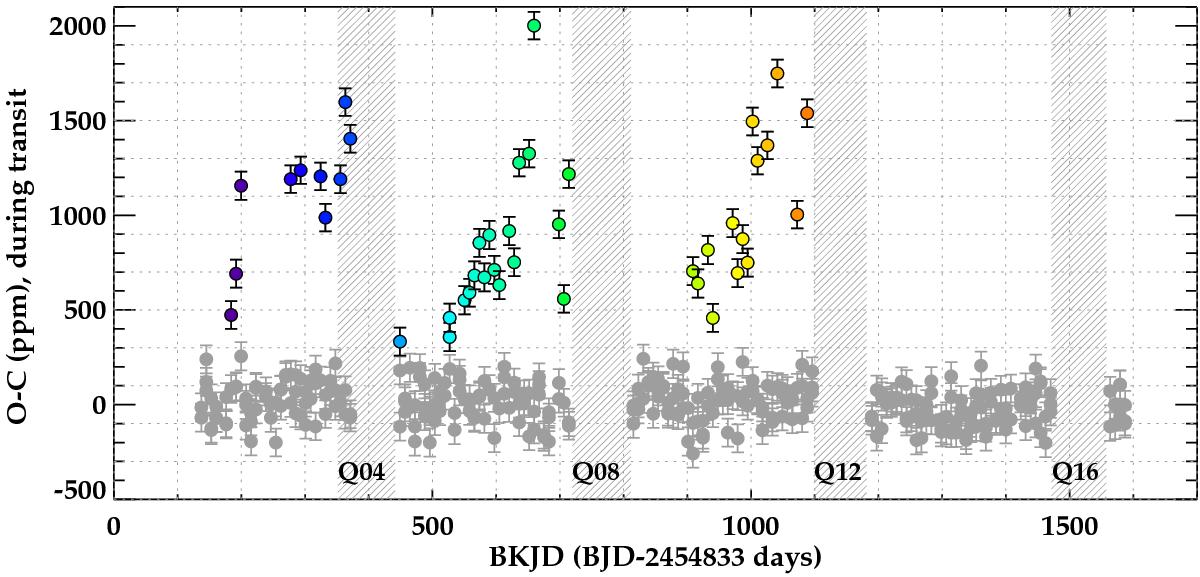
Flux difference between the observed measurement and the transit model for data points inside the transit region. Outliers mostly due to the misidentification of cosmic rays by the Kepler pipeline are marked in the same color code as in the right panel of Fig. 5. The Kepler quarters of the mission with few or no data for this KOIdue to the failure of CCD Module 3 are highlighted as gray shaded regions(see Sect. 2.1).
Current usage metrics show cumulative count of Article Views (full-text article views including HTML views, PDF and ePub downloads, according to the available data) and Abstracts Views on Vision4Press platform.
Data correspond to usage on the plateform after 2015. The current usage metrics is available 48-96 hours after online publication and is updated daily on week days.
Initial download of the metrics may take a while.