Fig. 5
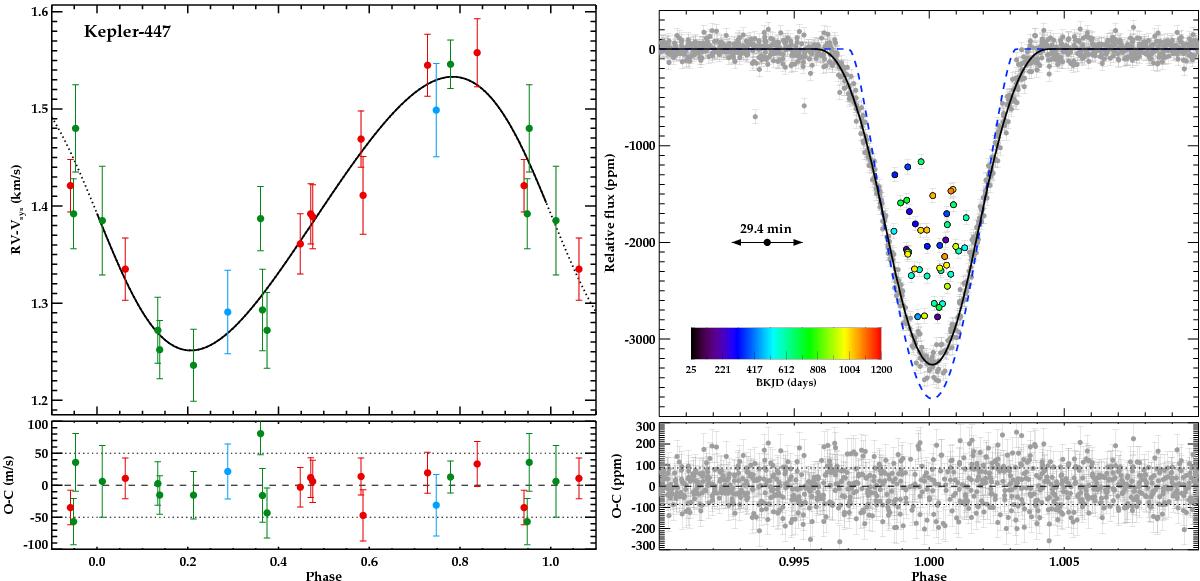
Left panel: phase-folded radial velocity data obtained during runs on 2012 (red symbols), 2013 (light blue), and 2014 (green). The black line shows the best fit model. Lower left panel: residuals of the model fit, with a rms of 31 m/s. Right panel: transit fitting of Kepler-447b. In the upper panel, we show the detected transit in the Kepler lightcurve. We mark in color the outliers of the transit that have been removed from the fitting process (see Sect. 3.2), and that are mostly due to the misidentification of cosmic rays by the Kepler pipeline. The color-code is shown in the color bar and relates to the corresponding Barycentric Kepler Julian Date (BKJD = BJD-2 454 833 days). The final fitted model is represented by the solid black line. We have also included with a dashed blue line the original (not binned) model from which it is calculated (see Sect. 3.4). The bottom panel shows the residuals of the fit, with a rms of 101 ppm.
Current usage metrics show cumulative count of Article Views (full-text article views including HTML views, PDF and ePub downloads, according to the available data) and Abstracts Views on Vision4Press platform.
Data correspond to usage on the plateform after 2015. The current usage metrics is available 48-96 hours after online publication and is updated daily on week days.
Initial download of the metrics may take a while.