Fig. 4
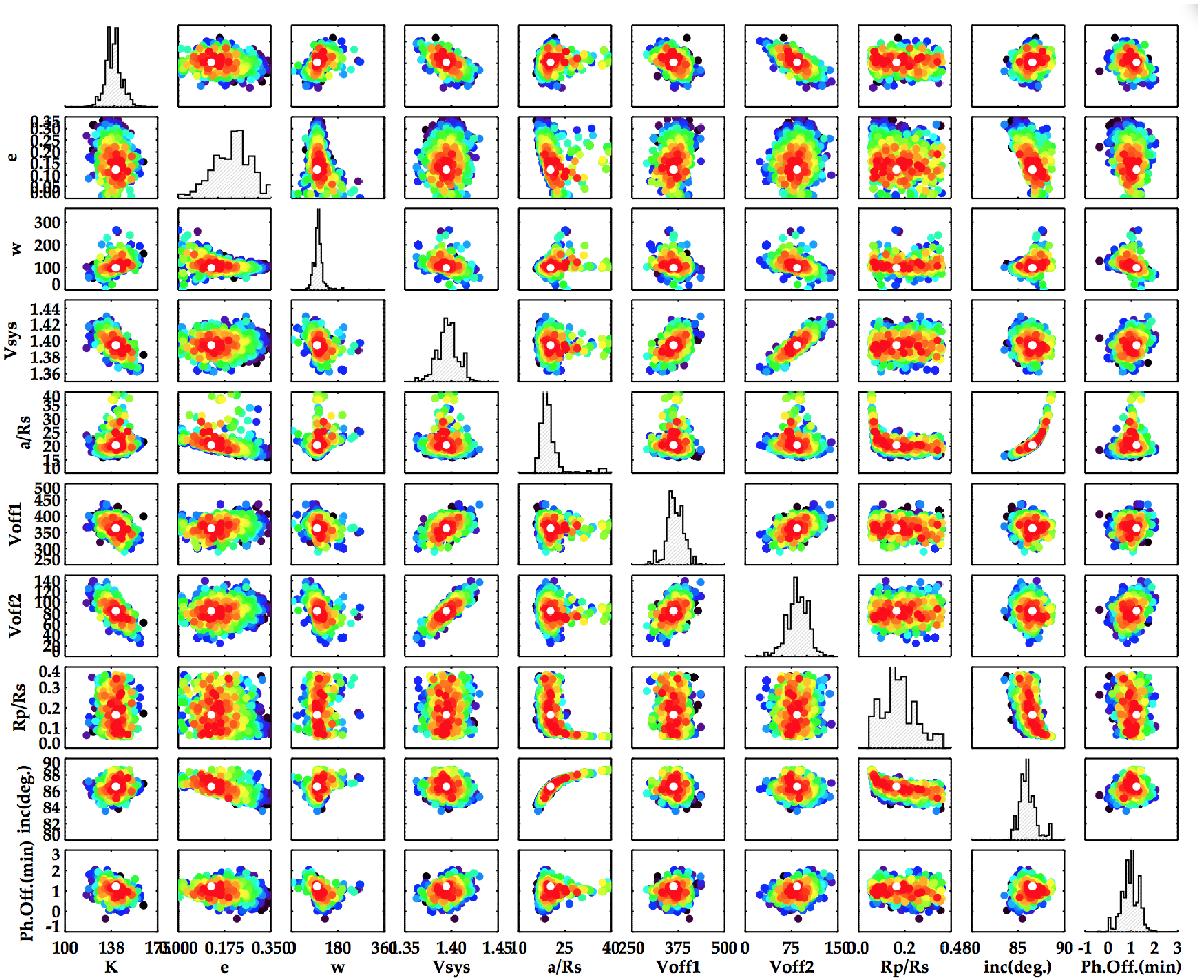
Parameter-parameter representation of the 1500 convergence solutions of the transit fitting using GAbox. In color-code we represent the combined reduced chi-square statistic of the RV and transit fitting models (dark colors represent poorer chi-square models). The diagonal panels show the histograms of the distribution of the individual parameters within all solutions. The white circle represents the least-square model.
Current usage metrics show cumulative count of Article Views (full-text article views including HTML views, PDF and ePub downloads, according to the available data) and Abstracts Views on Vision4Press platform.
Data correspond to usage on the plateform after 2015. The current usage metrics is available 48-96 hours after online publication and is updated daily on week days.
Initial download of the metrics may take a while.