Free Access
Fig. 3
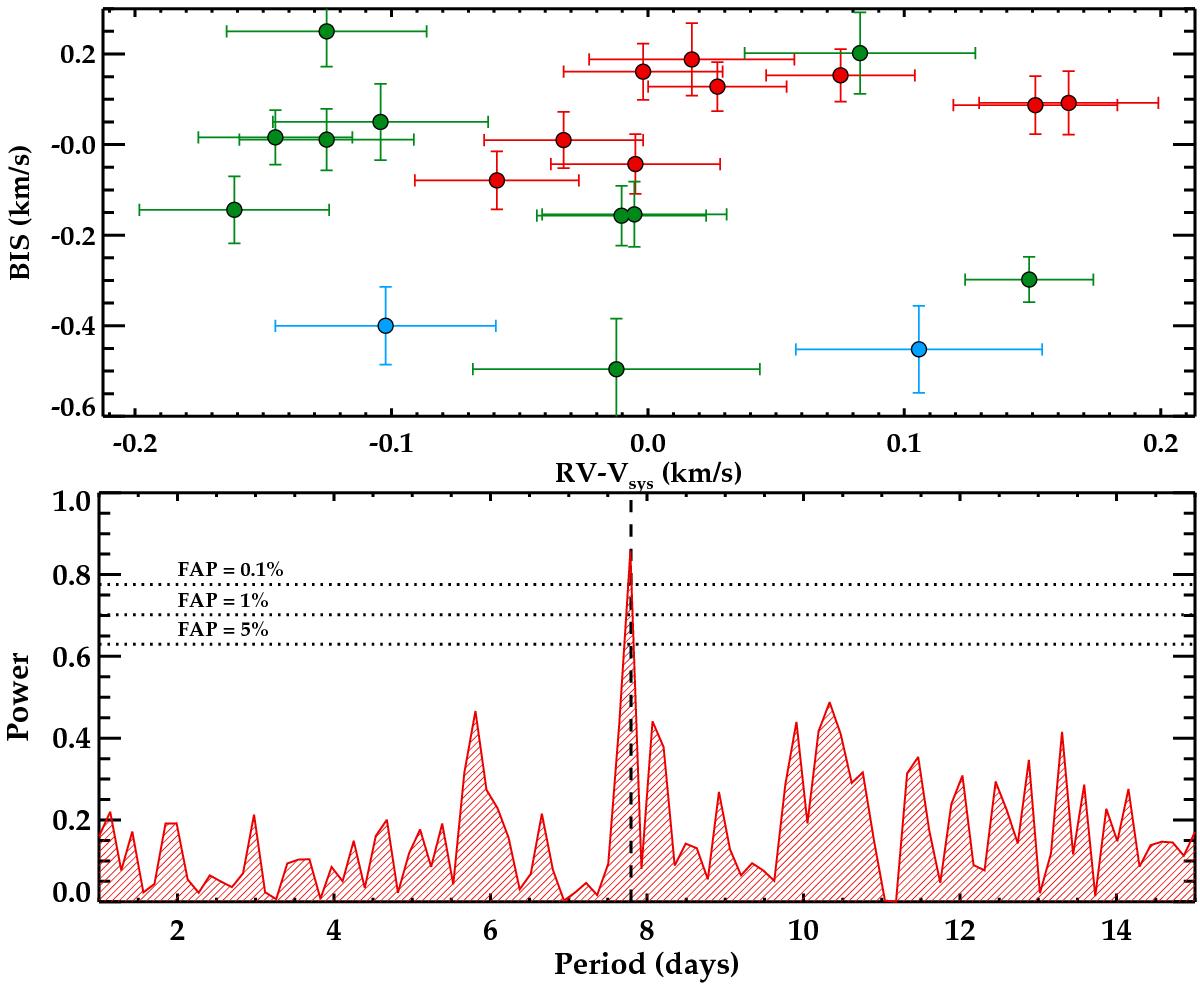
Upper panel: bisector analysis as a function of the measured radial velocity obtained during runs on 2012 (red symbols), 2013 (light blue), and 2014 (green). Lower panel: periodogram of the radial velocity data showing the significant peak at the corresponding transit period (vertical dashed line).
This figure is made of several images, please see below:
Current usage metrics show cumulative count of Article Views (full-text article views including HTML views, PDF and ePub downloads, according to the available data) and Abstracts Views on Vision4Press platform.
Data correspond to usage on the plateform after 2015. The current usage metrics is available 48-96 hours after online publication and is updated daily on week days.
Initial download of the metrics may take a while.