Fig. 2
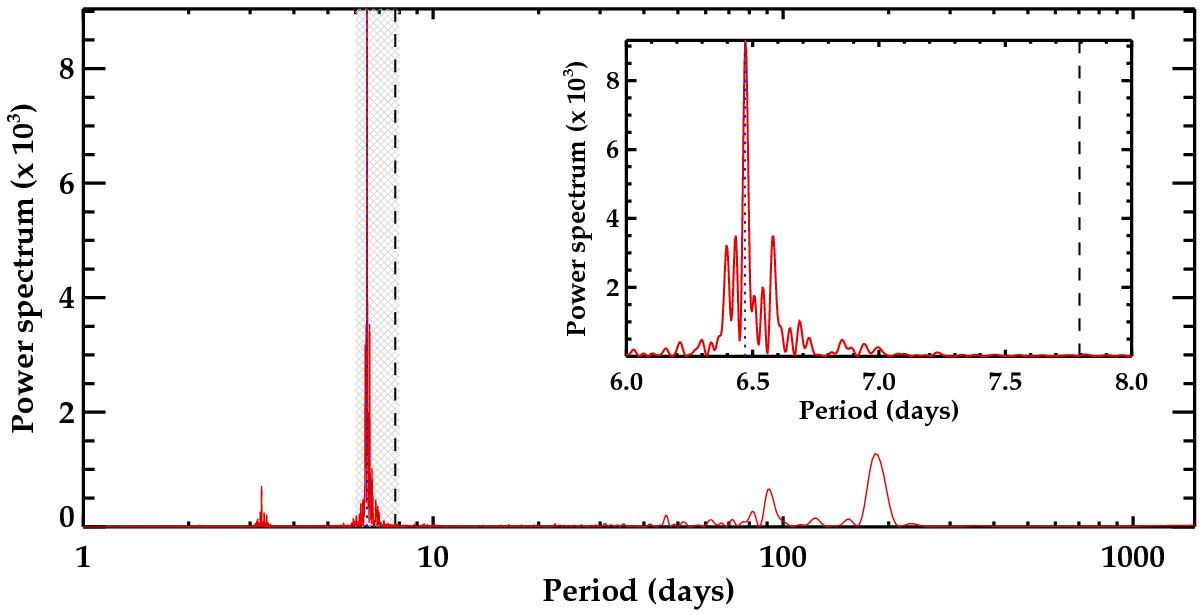
Lomb-Scargle periodogram of the complete Kepler lightcurve (red line). A zoom into the shaded region around the rotational period of the star (~6.5) days is shown in the small panel. The vertical dashed line corresponds to the orbital period, while the dotted vertical line is the measured rotational period by McQuillan et al. (2013b).
Current usage metrics show cumulative count of Article Views (full-text article views including HTML views, PDF and ePub downloads, according to the available data) and Abstracts Views on Vision4Press platform.
Data correspond to usage on the plateform after 2015. The current usage metrics is available 48-96 hours after online publication and is updated daily on week days.
Initial download of the metrics may take a while.