Fig. 1
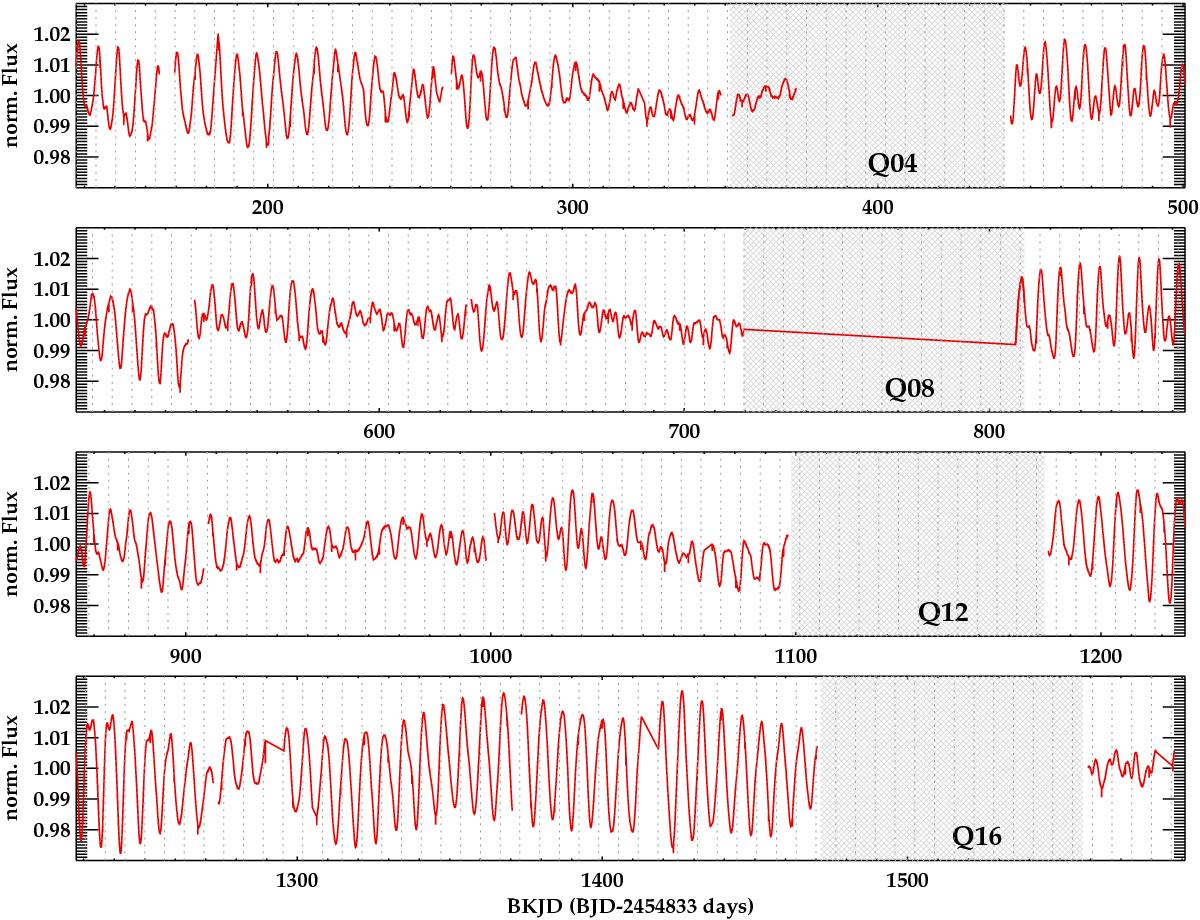
Photometric time series of Kepler-447 as obtained by the Kepler telescope. The simple aperture photometry (SAP) is plotted in red. The quarters in which the source felt in the death detector channels of the CCD are marked as shaded regions (see Sect. 2.1). The vertical dotted lines are plotted with a periodicity equal to the measured rotational period by McQuillan et al. (2013b).
Current usage metrics show cumulative count of Article Views (full-text article views including HTML views, PDF and ePub downloads, according to the available data) and Abstracts Views on Vision4Press platform.
Data correspond to usage on the plateform after 2015. The current usage metrics is available 48-96 hours after online publication and is updated daily on week days.
Initial download of the metrics may take a while.