Fig. 6
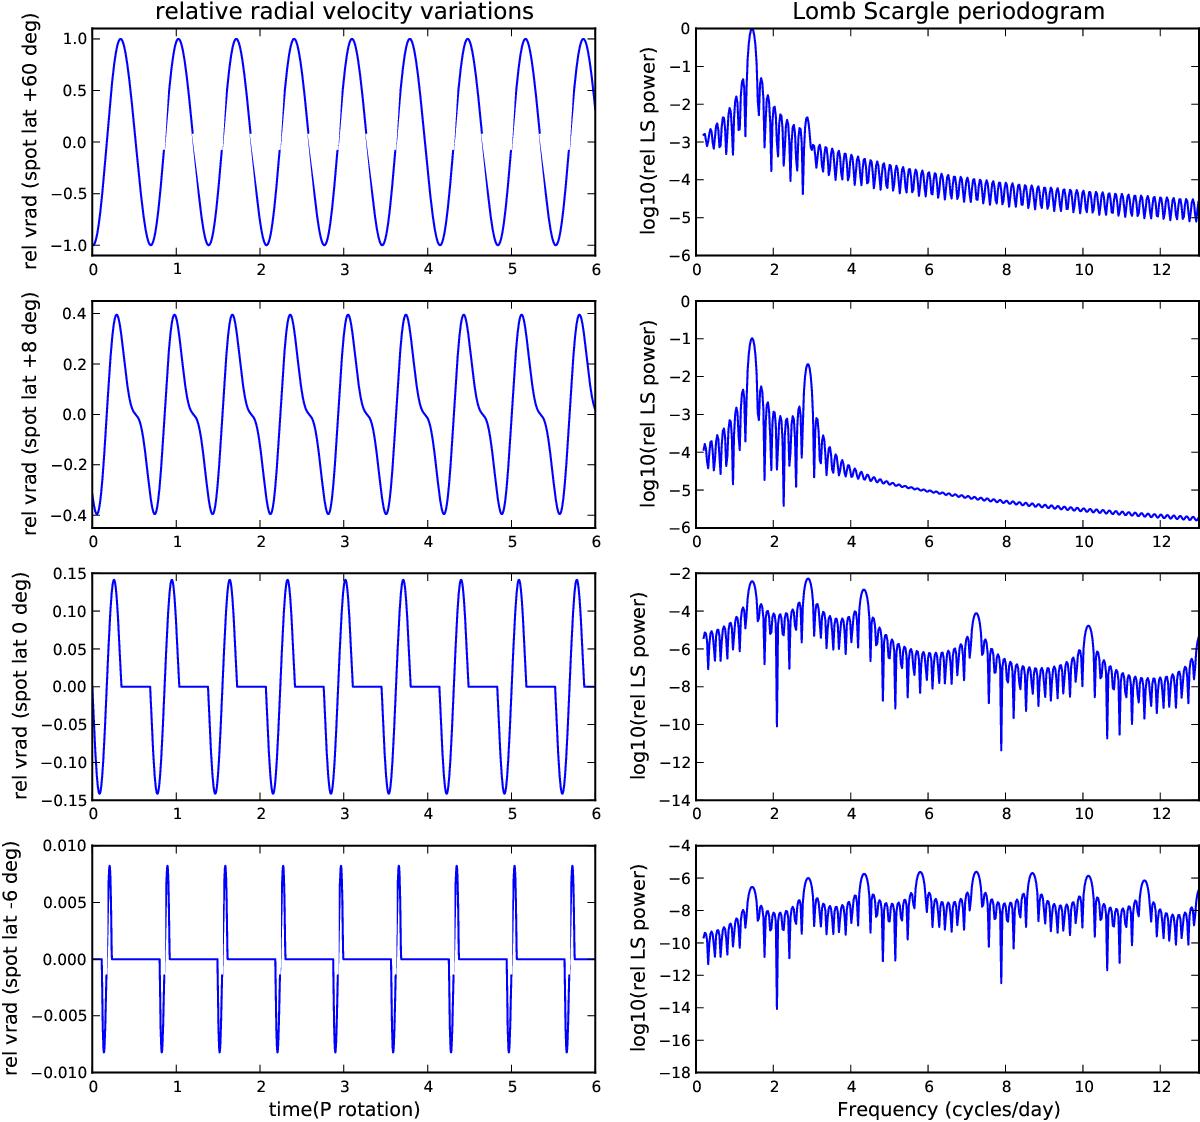
Simulation of the relative radial velocity variations induced by a spot (of same size) located at latitude (figures left, top to bottom): +60°, +8°, 0° and −6° for Vega (inclination angle i = 7°; the star is seen almost pole-on). Figures right, top to bottom: respective Lomb Scargle periodograms. The spot position at latitude +60° is taken as the reference with respect to the radial velocity and Lomb Scargle power spectrum amplitude.
Current usage metrics show cumulative count of Article Views (full-text article views including HTML views, PDF and ePub downloads, according to the available data) and Abstracts Views on Vision4Press platform.
Data correspond to usage on the plateform after 2015. The current usage metrics is available 48-96 hours after online publication and is updated daily on week days.
Initial download of the metrics may take a while.