Fig. 5
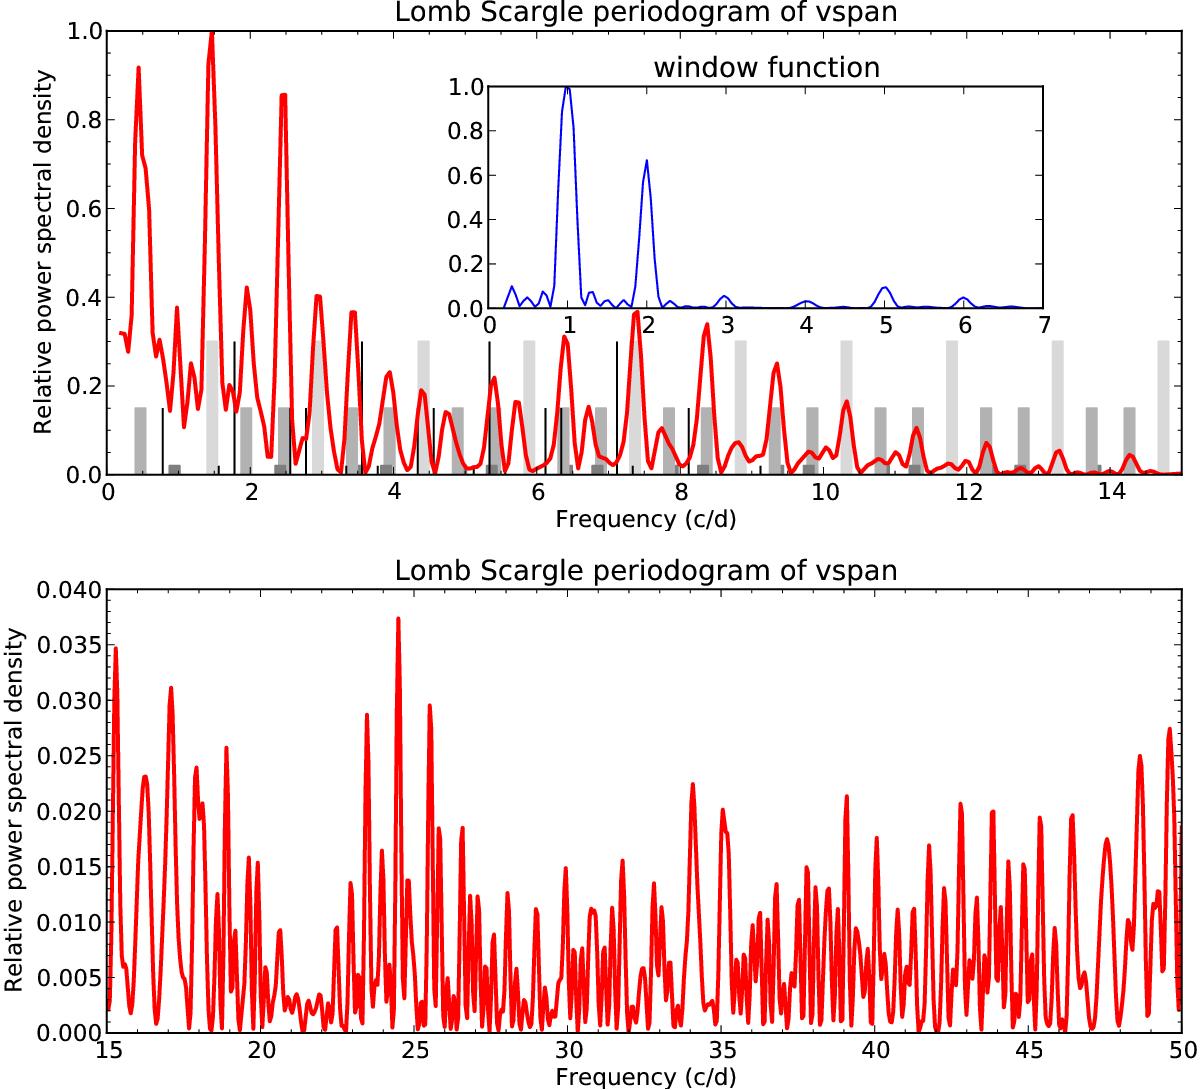
Lomb Scargle periodogram of vspan, including the window function of the data set. The grey bars at 0.3 height indicate the rotational frequency of the star as determined by Alina et al. (2012), i.e. 1.47 d-1, as well as its harmonics (multiple of this frequency). Its width corresponds to the error bar. The lower bars at 0.15 and 0.02 height indicate the position of the ±1 and 2-day aliases with respect to the rotational frequency comb, respectively. The thin vertical black line indicates the same kind of frequency grid for a frequency of 1.77 d-1 (see Sect. 3.3).
Current usage metrics show cumulative count of Article Views (full-text article views including HTML views, PDF and ePub downloads, according to the available data) and Abstracts Views on Vision4Press platform.
Data correspond to usage on the plateform after 2015. The current usage metrics is available 48-96 hours after online publication and is updated daily on week days.
Initial download of the metrics may take a while.