Fig. 15
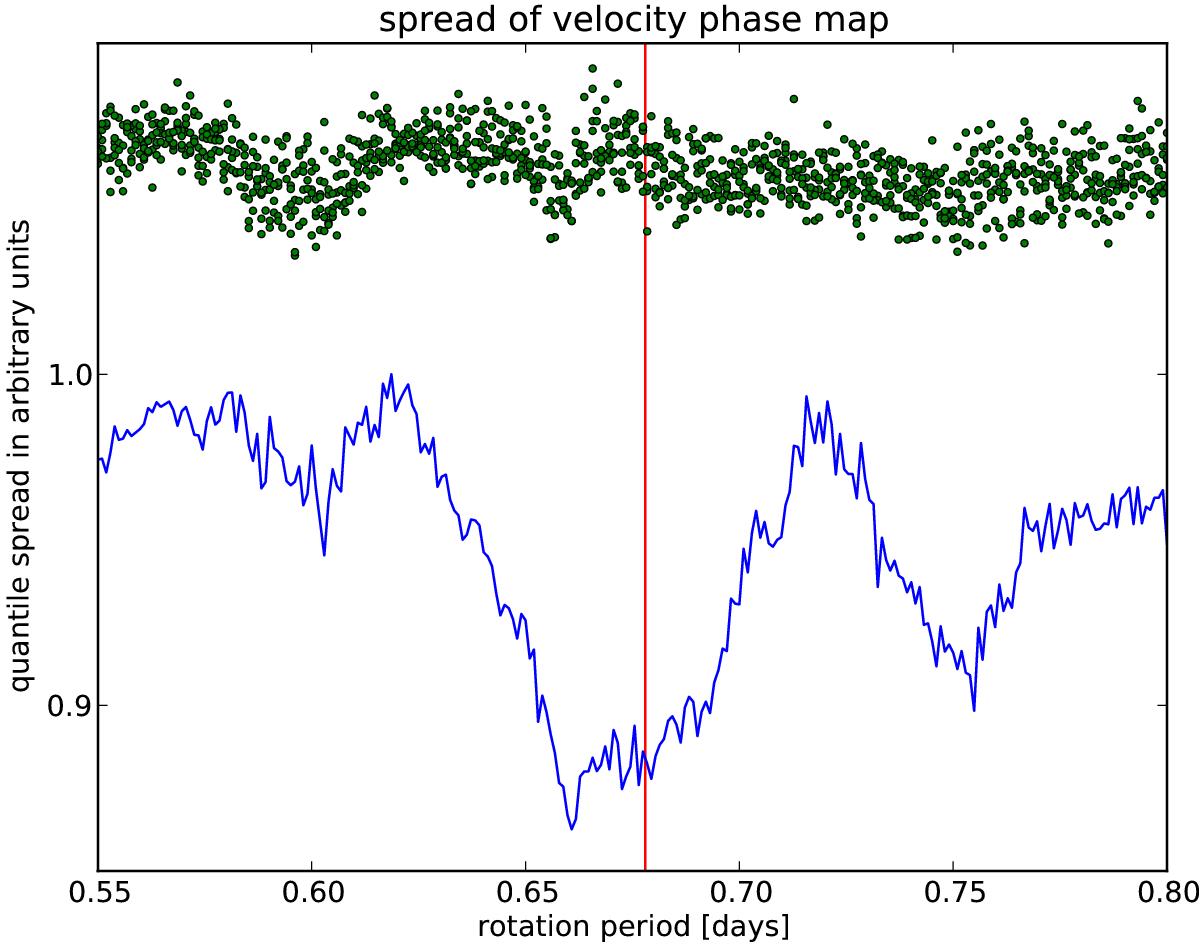
Optimal coherence is searched for a temporal remapping of the data set presented in Fig. 13 around the pre-estimated rotational period. Optimality is based on the spread of the cloud in three dimensions (binned data in time modulo Prot, intensity, velocity). It can be seen that Prot = 0.678 d corresponds to the best matching period (blue line). To assess significance we used the same data set with a randomly permutated time data set (green dots).
Current usage metrics show cumulative count of Article Views (full-text article views including HTML views, PDF and ePub downloads, according to the available data) and Abstracts Views on Vision4Press platform.
Data correspond to usage on the plateform after 2015. The current usage metrics is available 48-96 hours after online publication and is updated daily on week days.
Initial download of the metrics may take a while.