Press Release
Free Access
Fig. 10
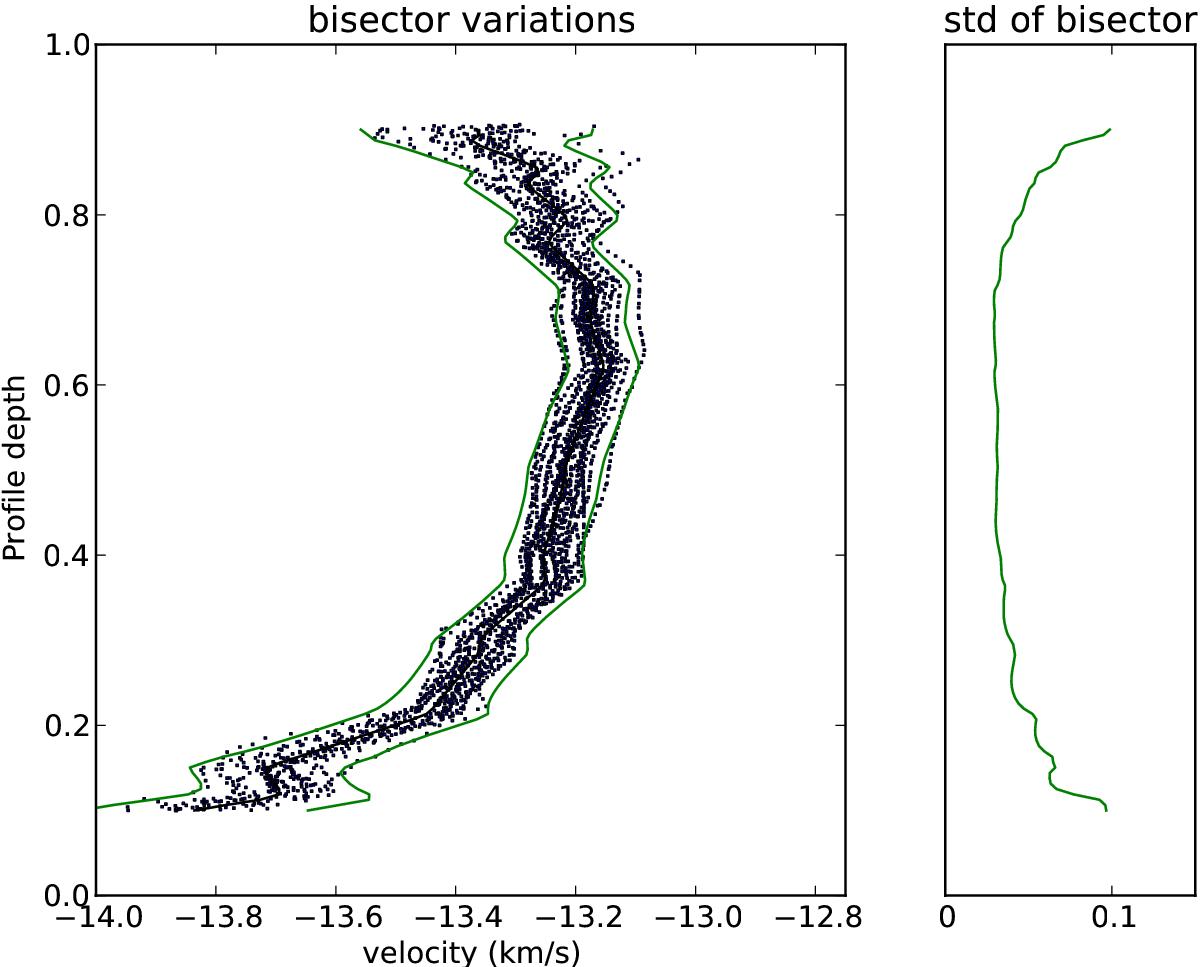
Distribution of bisectors in the total data set is represented in the left-hand figure. The green lines enclose 95% credibility intervals for each depth. Right-hand figure: standard deviation of the bisector variations as a function of renormalized profile depth.
Current usage metrics show cumulative count of Article Views (full-text article views including HTML views, PDF and ePub downloads, according to the available data) and Abstracts Views on Vision4Press platform.
Data correspond to usage on the plateform after 2015. The current usage metrics is available 48-96 hours after online publication and is updated daily on week days.
Initial download of the metrics may take a while.