Fig. 8
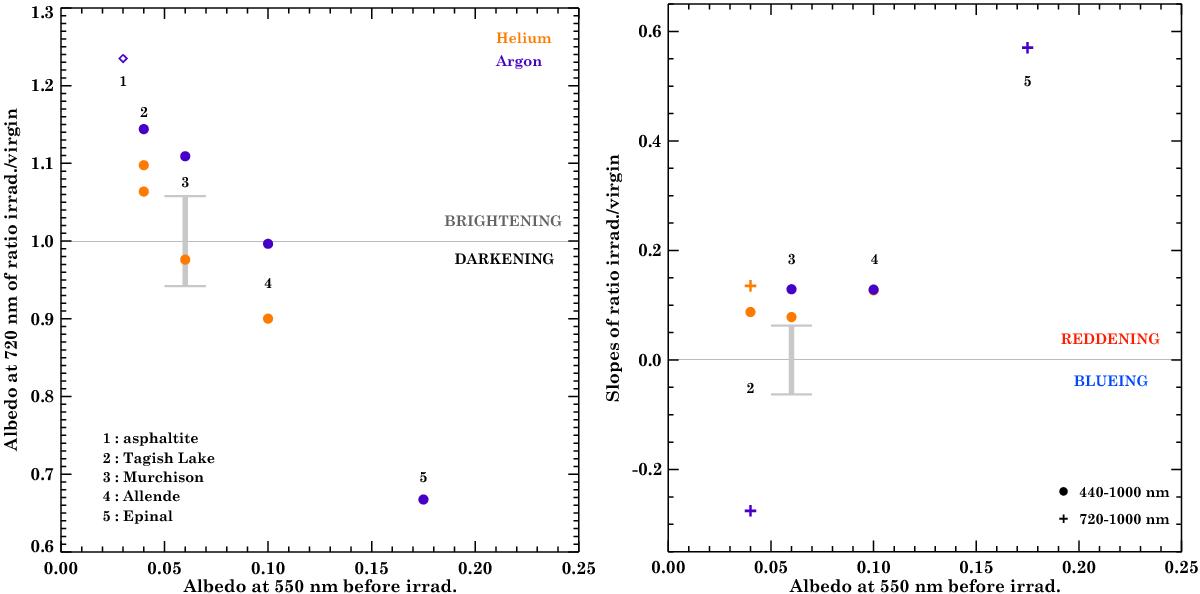
Value of reflectance at 0.72 μm (left panel) and spectral slopes (right panel) of the Fig. 7 ratios: virgin sample over irradiated sample. The orange dots are for irradiations with He+ ions, purple is used for Ar+ ions. The spectral slope is calculated using a linear fit on the whole range (0.44-1.0 μm, dots) when available or on a restricted area (0.72-1.0 μm, + signs) otherwise. The gray error bar in each panel indicates the variations due to our Murchison sample heterogeneity.
Current usage metrics show cumulative count of Article Views (full-text article views including HTML views, PDF and ePub downloads, according to the available data) and Abstracts Views on Vision4Press platform.
Data correspond to usage on the plateform after 2015. The current usage metrics is available 48-96 hours after online publication and is updated daily on week days.
Initial download of the metrics may take a while.