Fig. 3
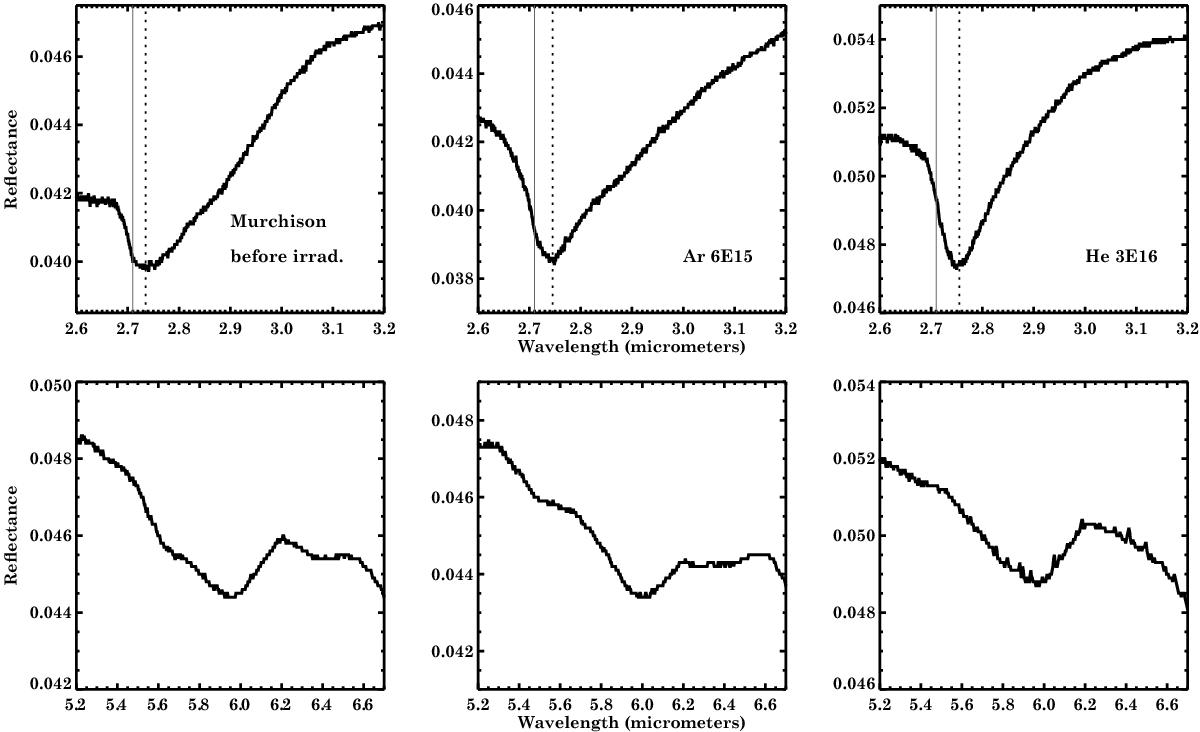
NIR confocal reflectance spectra around aqueous alteration bands (OH-stretching on top, H2O-bending on bottom) for the non-irradiated Murchison pellet area (left), and the highest fluence of irradiation for argon (central) and helium (right) ions. For the stretching mode: the gray line indicates the 2.71 μm position on each plot, the dotted line indicates the band minimum shifting toward longer wavelength with increasing irradiation dose.
Current usage metrics show cumulative count of Article Views (full-text article views including HTML views, PDF and ePub downloads, according to the available data) and Abstracts Views on Vision4Press platform.
Data correspond to usage on the plateform after 2015. The current usage metrics is available 48-96 hours after online publication and is updated daily on week days.
Initial download of the metrics may take a while.