Fig. 6
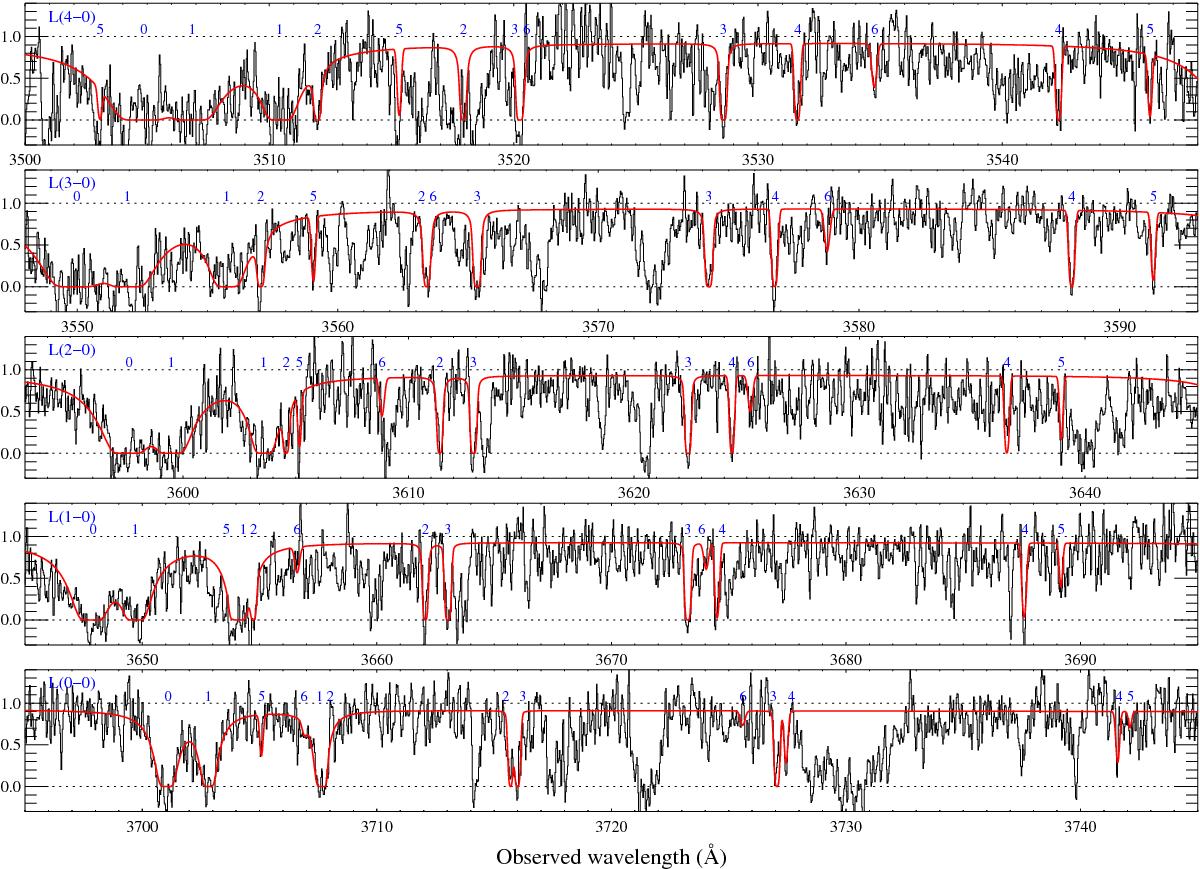
Portions of the UVES spectrum of J2140−0321 covering H2 absorption lines at zabs = 2.34. The data has been boxcar-smoothed by 3 pixels only for the sake of visual clarity. Each wavelength region covers a Lyman band, indicated in the top left corner of each panel. The numbers in blue above each absorption line indicate the rotational level to which the line belongs.
Current usage metrics show cumulative count of Article Views (full-text article views including HTML views, PDF and ePub downloads, according to the available data) and Abstracts Views on Vision4Press platform.
Data correspond to usage on the plateform after 2015. The current usage metrics is available 48-96 hours after online publication and is updated daily on week days.
Initial download of the metrics may take a while.