Fig. 5
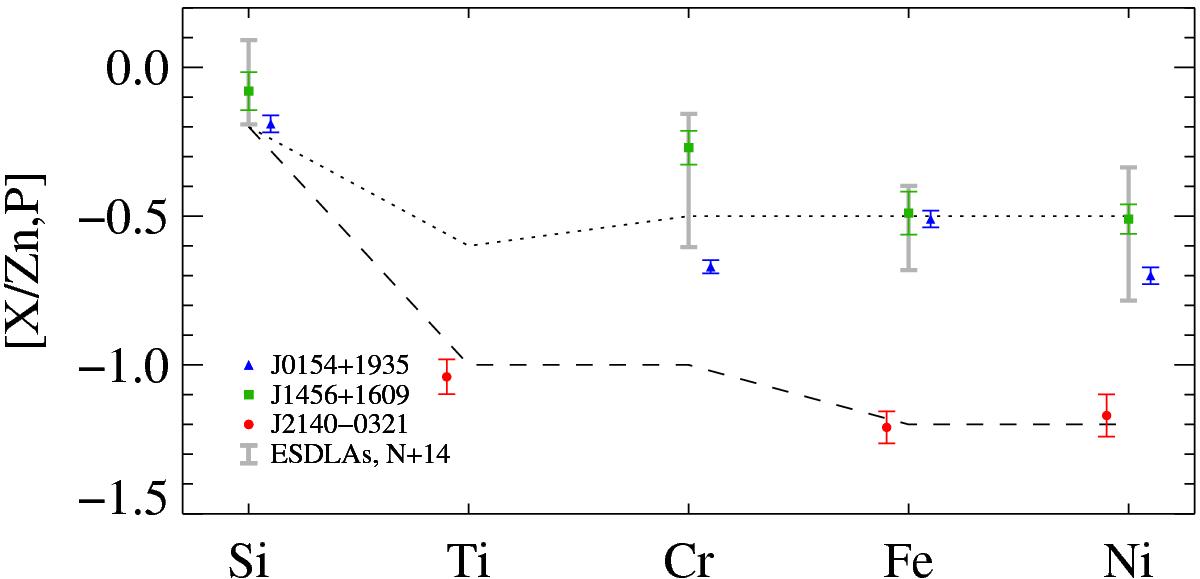
Depletion patterns of different elements. For J2140−0321 we use the phosphorus abundance (relative to solar) as a proxy for that of zinc. The grey bars correspond to the value obtained from averaging low-resolution BOSS spectra of ESDLAs (Noterdaeme et al. 2014). The dotted (resp. dashed) line corresponds to the Milky-Way halo (resp. warm disc) depletion pattern.
Current usage metrics show cumulative count of Article Views (full-text article views including HTML views, PDF and ePub downloads, according to the available data) and Abstracts Views on Vision4Press platform.
Data correspond to usage on the plateform after 2015. The current usage metrics is available 48-96 hours after online publication and is updated daily on week days.
Initial download of the metrics may take a while.