Fig. 18
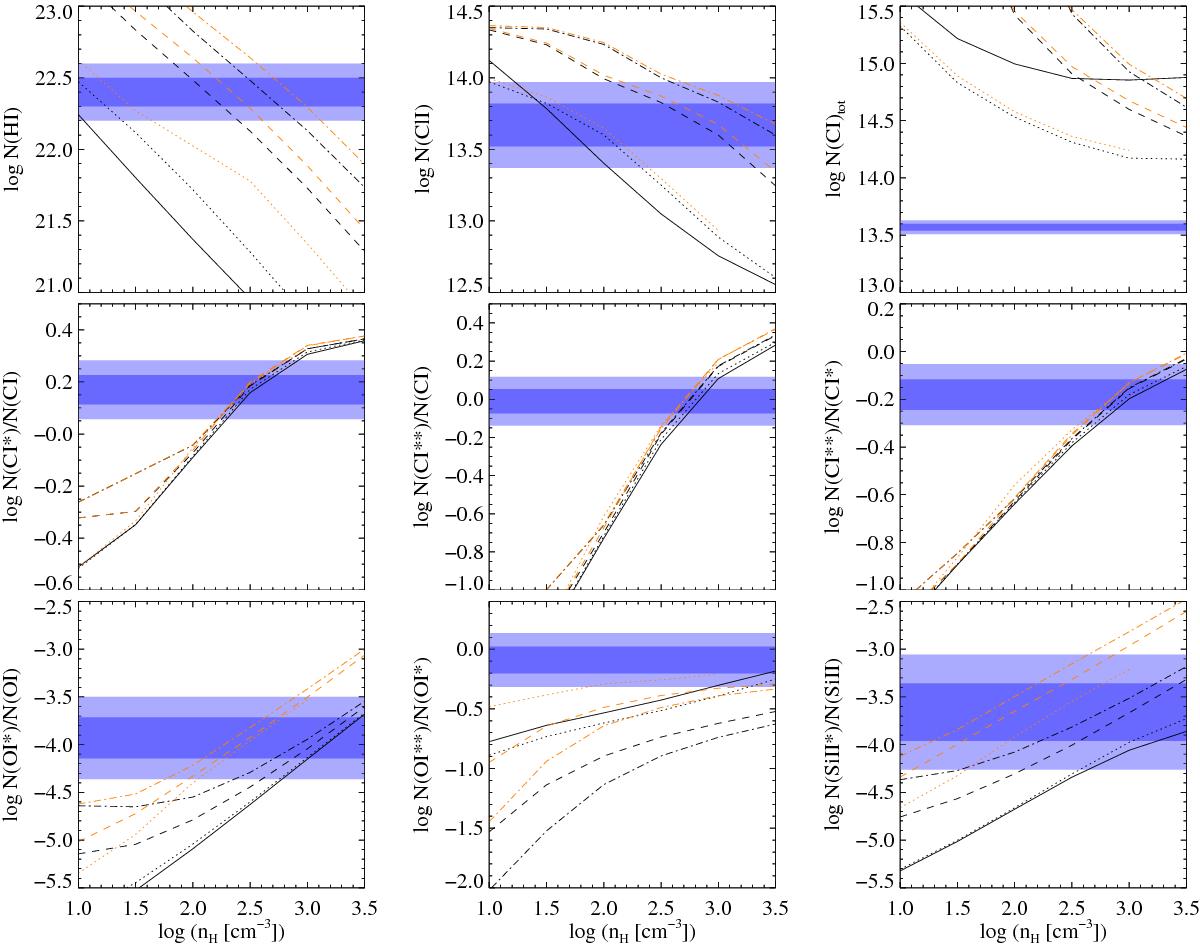
Results of photo-ionisation models. For each hydrogen density the calculation is stopped when the observed N(H2) is reached. The blue shaded regions give the 1 and 2σ range on the total column density (top) or column density ratios (bottom) from the observations. The solid, dotted, dashed and dashed-dotted lines correspond to an in situ radiation field of respectively χ = 0,1,10,30 times the local Galactic field. The cold-gas-only model (T = 80 K, log N(H2) = 20.13) is represented by black lines while the orange lines represent the model with an additional warm component (T = 300 K and log N(H2) = 19).
Current usage metrics show cumulative count of Article Views (full-text article views including HTML views, PDF and ePub downloads, according to the available data) and Abstracts Views on Vision4Press platform.
Data correspond to usage on the plateform after 2015. The current usage metrics is available 48-96 hours after online publication and is updated daily on week days.
Initial download of the metrics may take a while.