Free Access
Fig. 12
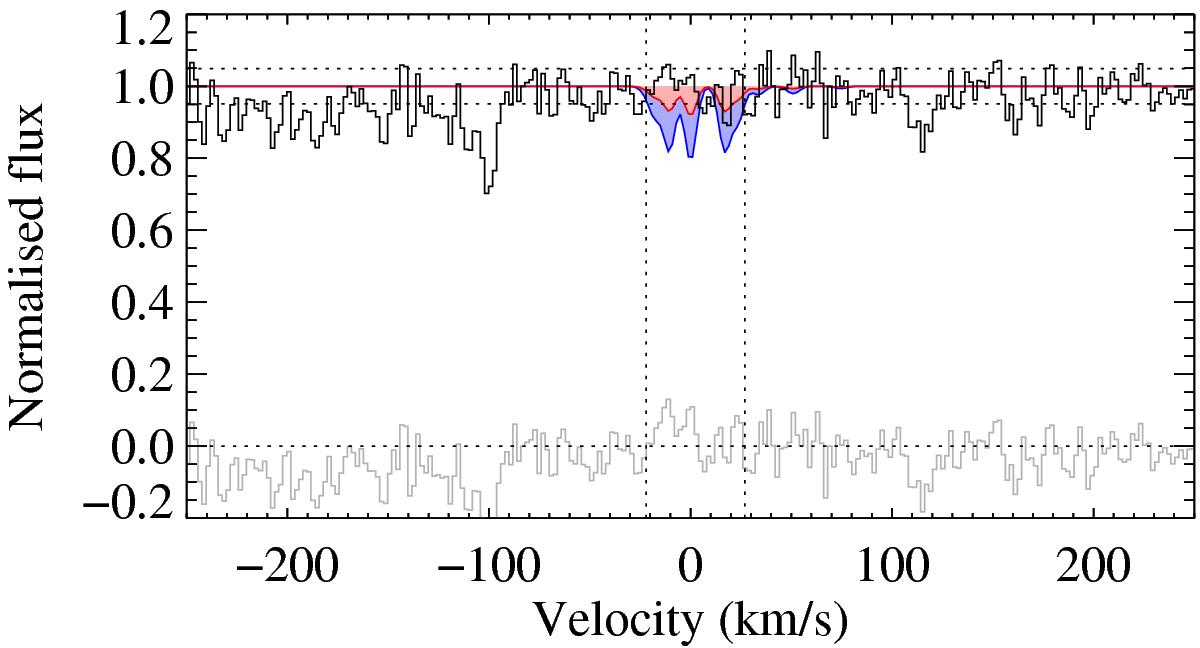
Stack of covered CO AX absorption bands (from (0−0) to (3−0)) towards J2140. The red (resp. blue) profiles correspond to the expected profile having 1 time (resp. 3 times) the area sustained by noise (horizontal dotted lines) over the velocity range covered by the band (vertical lines) and assuming Tex = TCMB.
Current usage metrics show cumulative count of Article Views (full-text article views including HTML views, PDF and ePub downloads, according to the available data) and Abstracts Views on Vision4Press platform.
Data correspond to usage on the plateform after 2015. The current usage metrics is available 48-96 hours after online publication and is updated daily on week days.
Initial download of the metrics may take a while.