Free Access
Fig. A.1
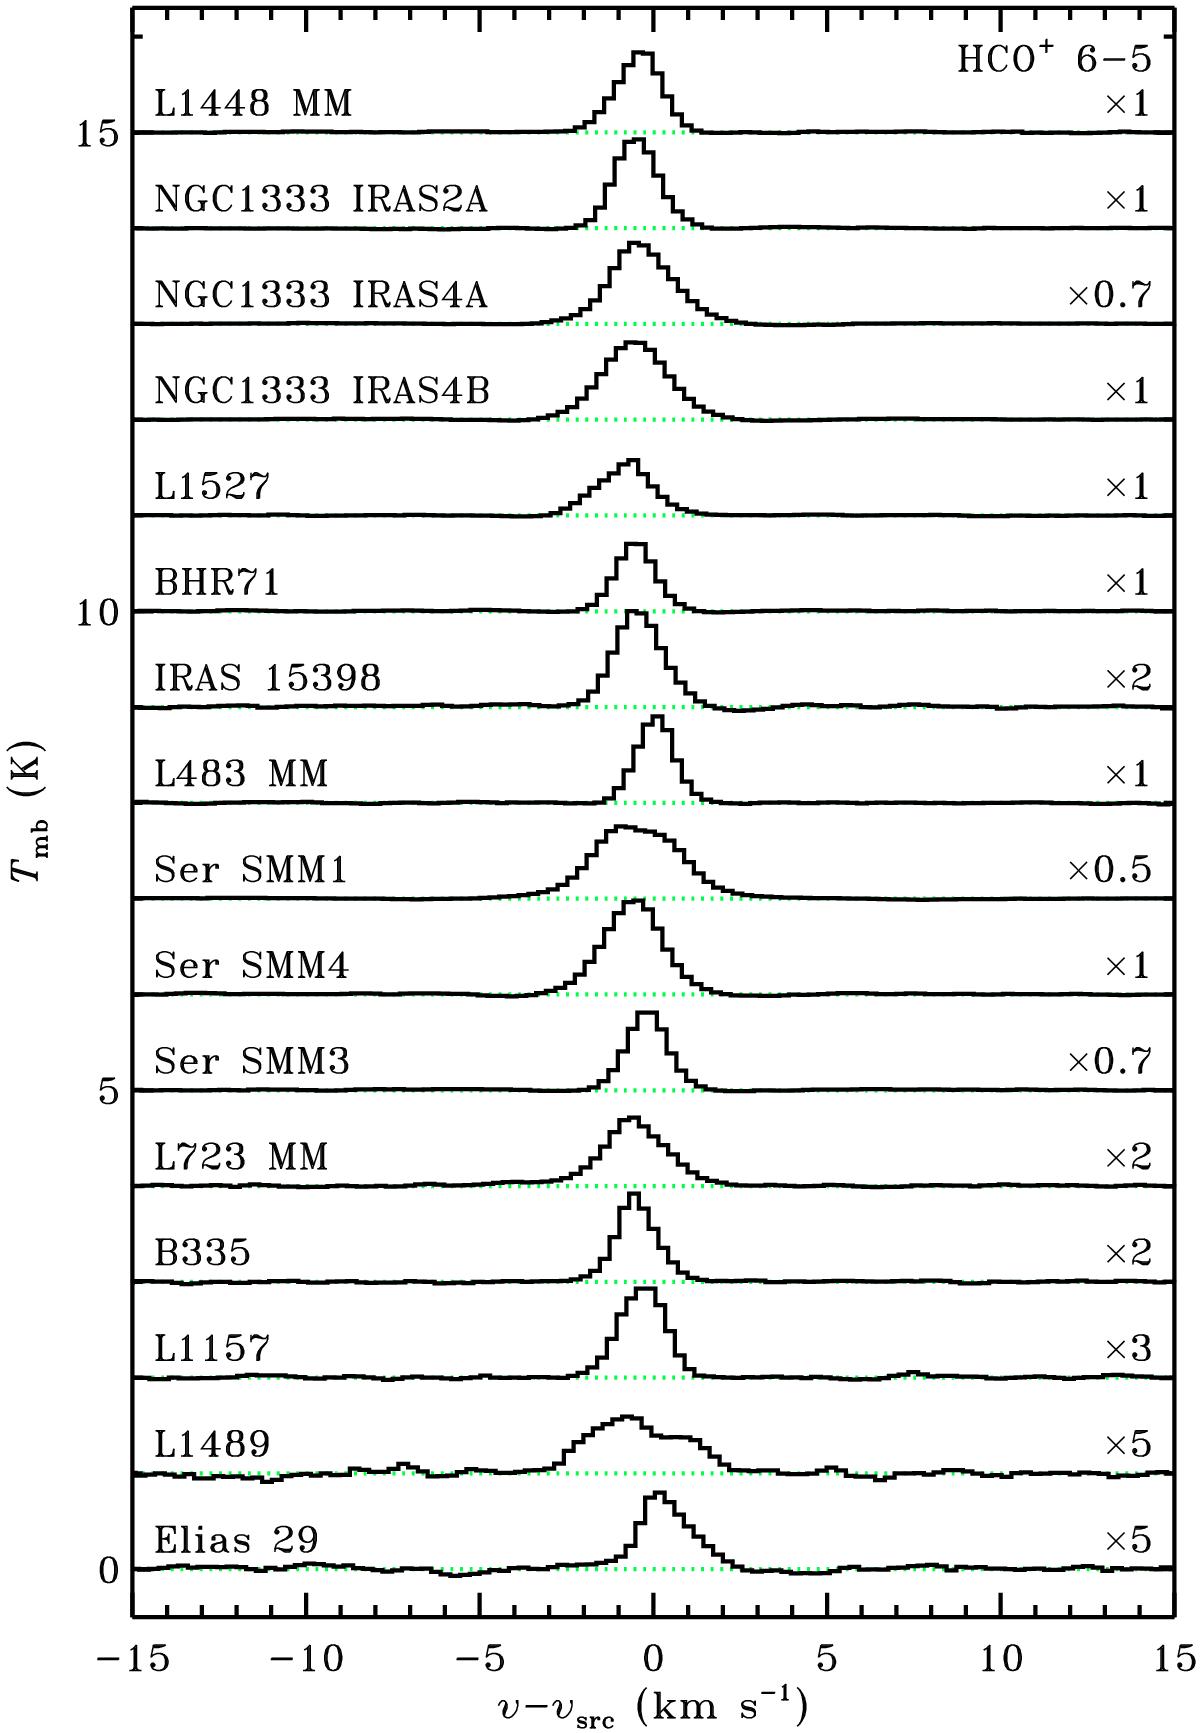
Spectra of HCO+ 6–5, corrected for source velocity and scaled as indicated. If a broad emission component from the outflow was present (in all sources but L723 and B335), it was fitted with a Gaussian profile and subtracted from the spectrum to leave only the narrow emission from the quiescent envelope.
Current usage metrics show cumulative count of Article Views (full-text article views including HTML views, PDF and ePub downloads, according to the available data) and Abstracts Views on Vision4Press platform.
Data correspond to usage on the plateform after 2015. The current usage metrics is available 48-96 hours after online publication and is updated daily on week days.
Initial download of the metrics may take a while.