Free Access
Fig. 5
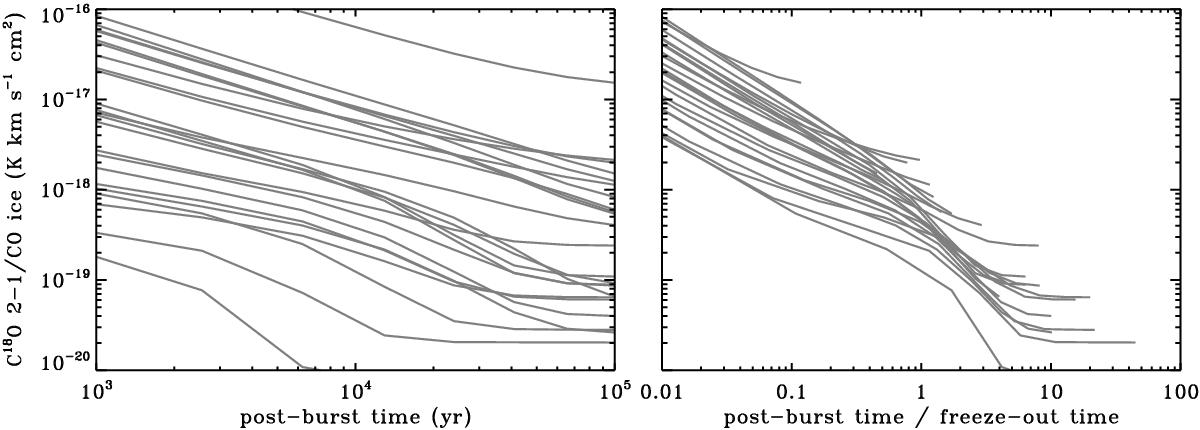
Left: ratio between the integrated intensity of C18O 2–1 and the column density of CO ice as a function of time during the quiescent phase. Each gray curve corresponds to one source. Right: same, but with the time axis normalized by the characteristic freeze-out timescale for each source.
Current usage metrics show cumulative count of Article Views (full-text article views including HTML views, PDF and ePub downloads, according to the available data) and Abstracts Views on Vision4Press platform.
Data correspond to usage on the plateform after 2015. The current usage metrics is available 48-96 hours after online publication and is updated daily on week days.
Initial download of the metrics may take a while.