Fig. 3
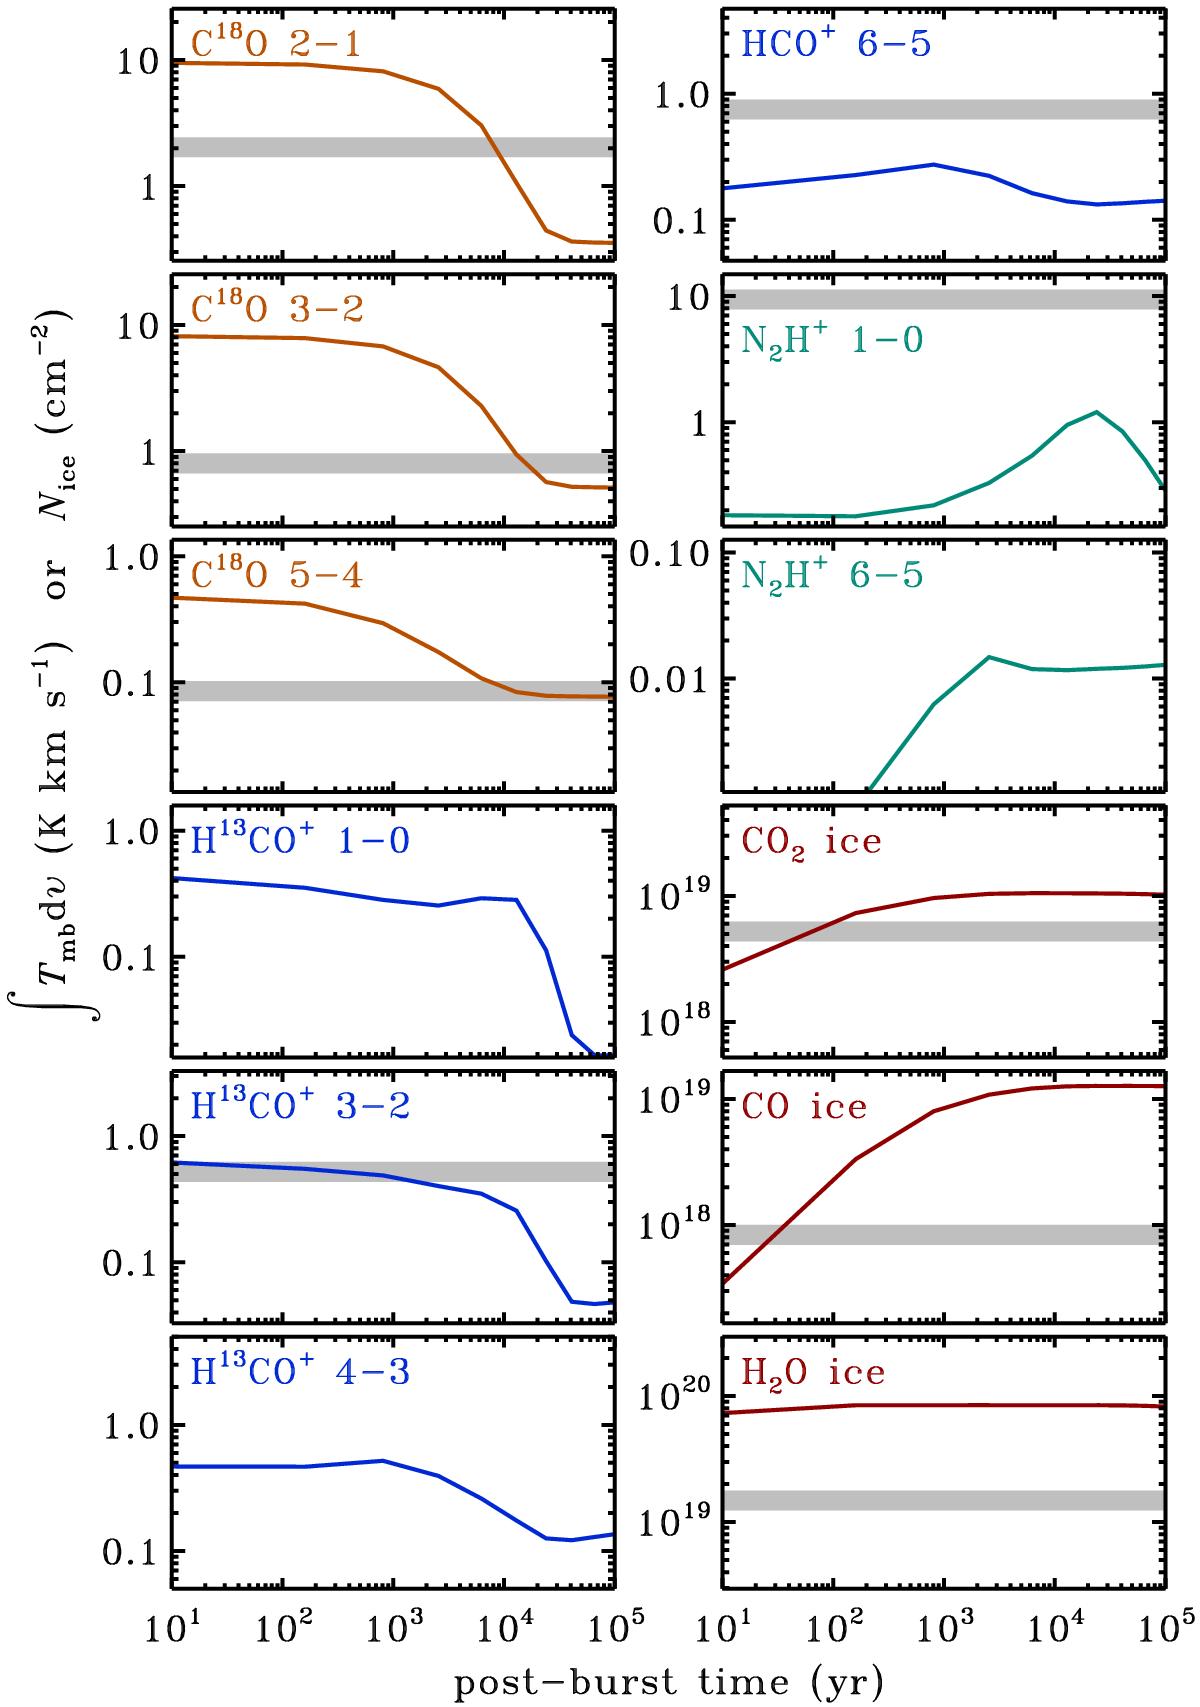
Simulated integrated line intensities and ice column densities in IRAS 15398 as a function of time during the quiescent phase. The N2H+J = 1–0 and 6–5 intensities are summed over all HF components. Where available, the gray bars show the observed intensities and columns from Tables 1 and 2 with 20% uncertainties.
Current usage metrics show cumulative count of Article Views (full-text article views including HTML views, PDF and ePub downloads, according to the available data) and Abstracts Views on Vision4Press platform.
Data correspond to usage on the plateform after 2015. The current usage metrics is available 48-96 hours after online publication and is updated daily on week days.
Initial download of the metrics may take a while.