Fig. 2
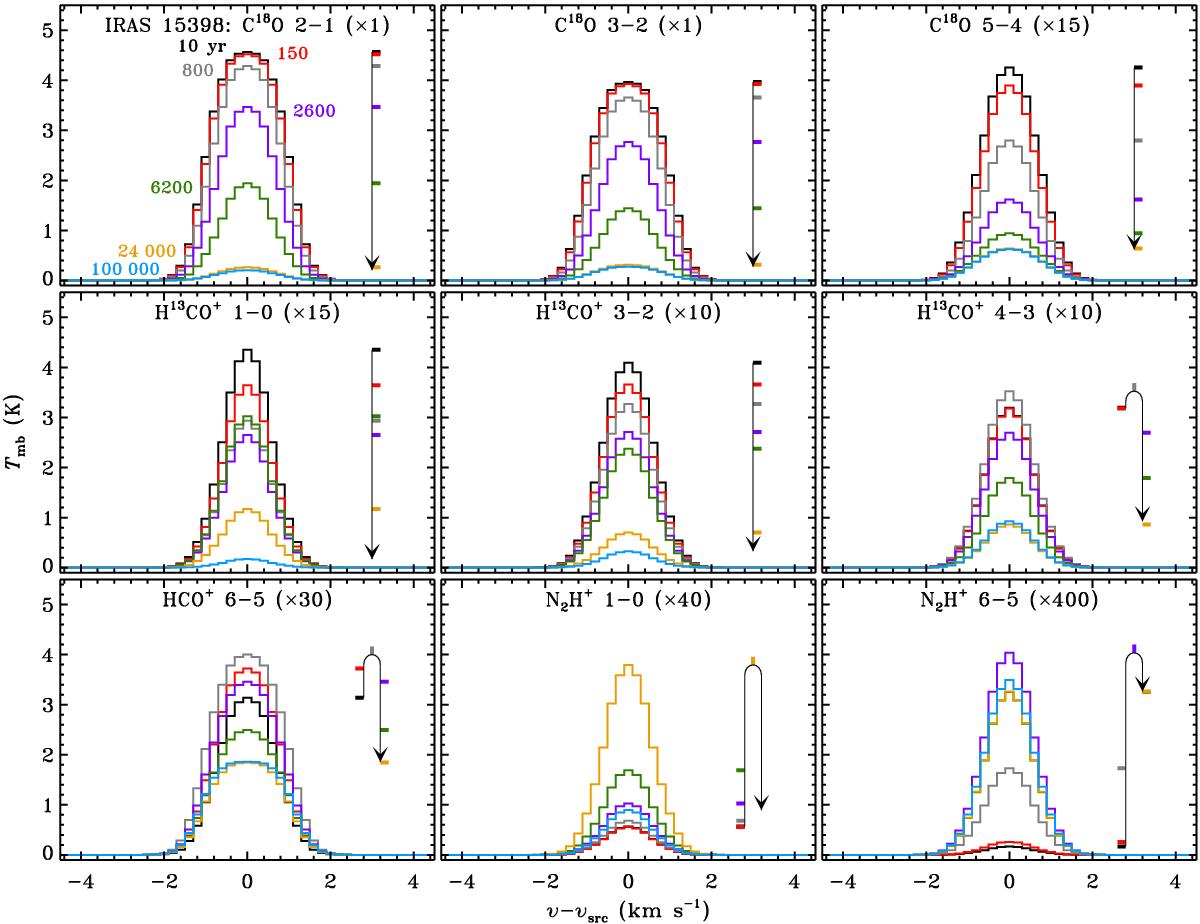
Synthetic spectra for the quiescent phase in IRAS 15398, scaled as indicated. The different colors correspond to the same post-burst time steps as in Fig. 1: 10 yr (black), 150 yr (red), 800 yr (gray), 2600 yr (purple), 6200 yr (green), 24 000 yr (orange), and 1 × 10⁵ yr (blue). The arrows indicate how the intensity of each line changes as a function of time; the colored flags mark the peak intensities at the listed times. The N2H+ 1–0 panel shows the isolated F1 = 0−1 hyperfine component, whereas the 6–5 panel shows the sum over all unresolved components.
Current usage metrics show cumulative count of Article Views (full-text article views including HTML views, PDF and ePub downloads, according to the available data) and Abstracts Views on Vision4Press platform.
Data correspond to usage on the plateform after 2015. The current usage metrics is available 48-96 hours after online publication and is updated daily on week days.
Initial download of the metrics may take a while.