Fig. 1
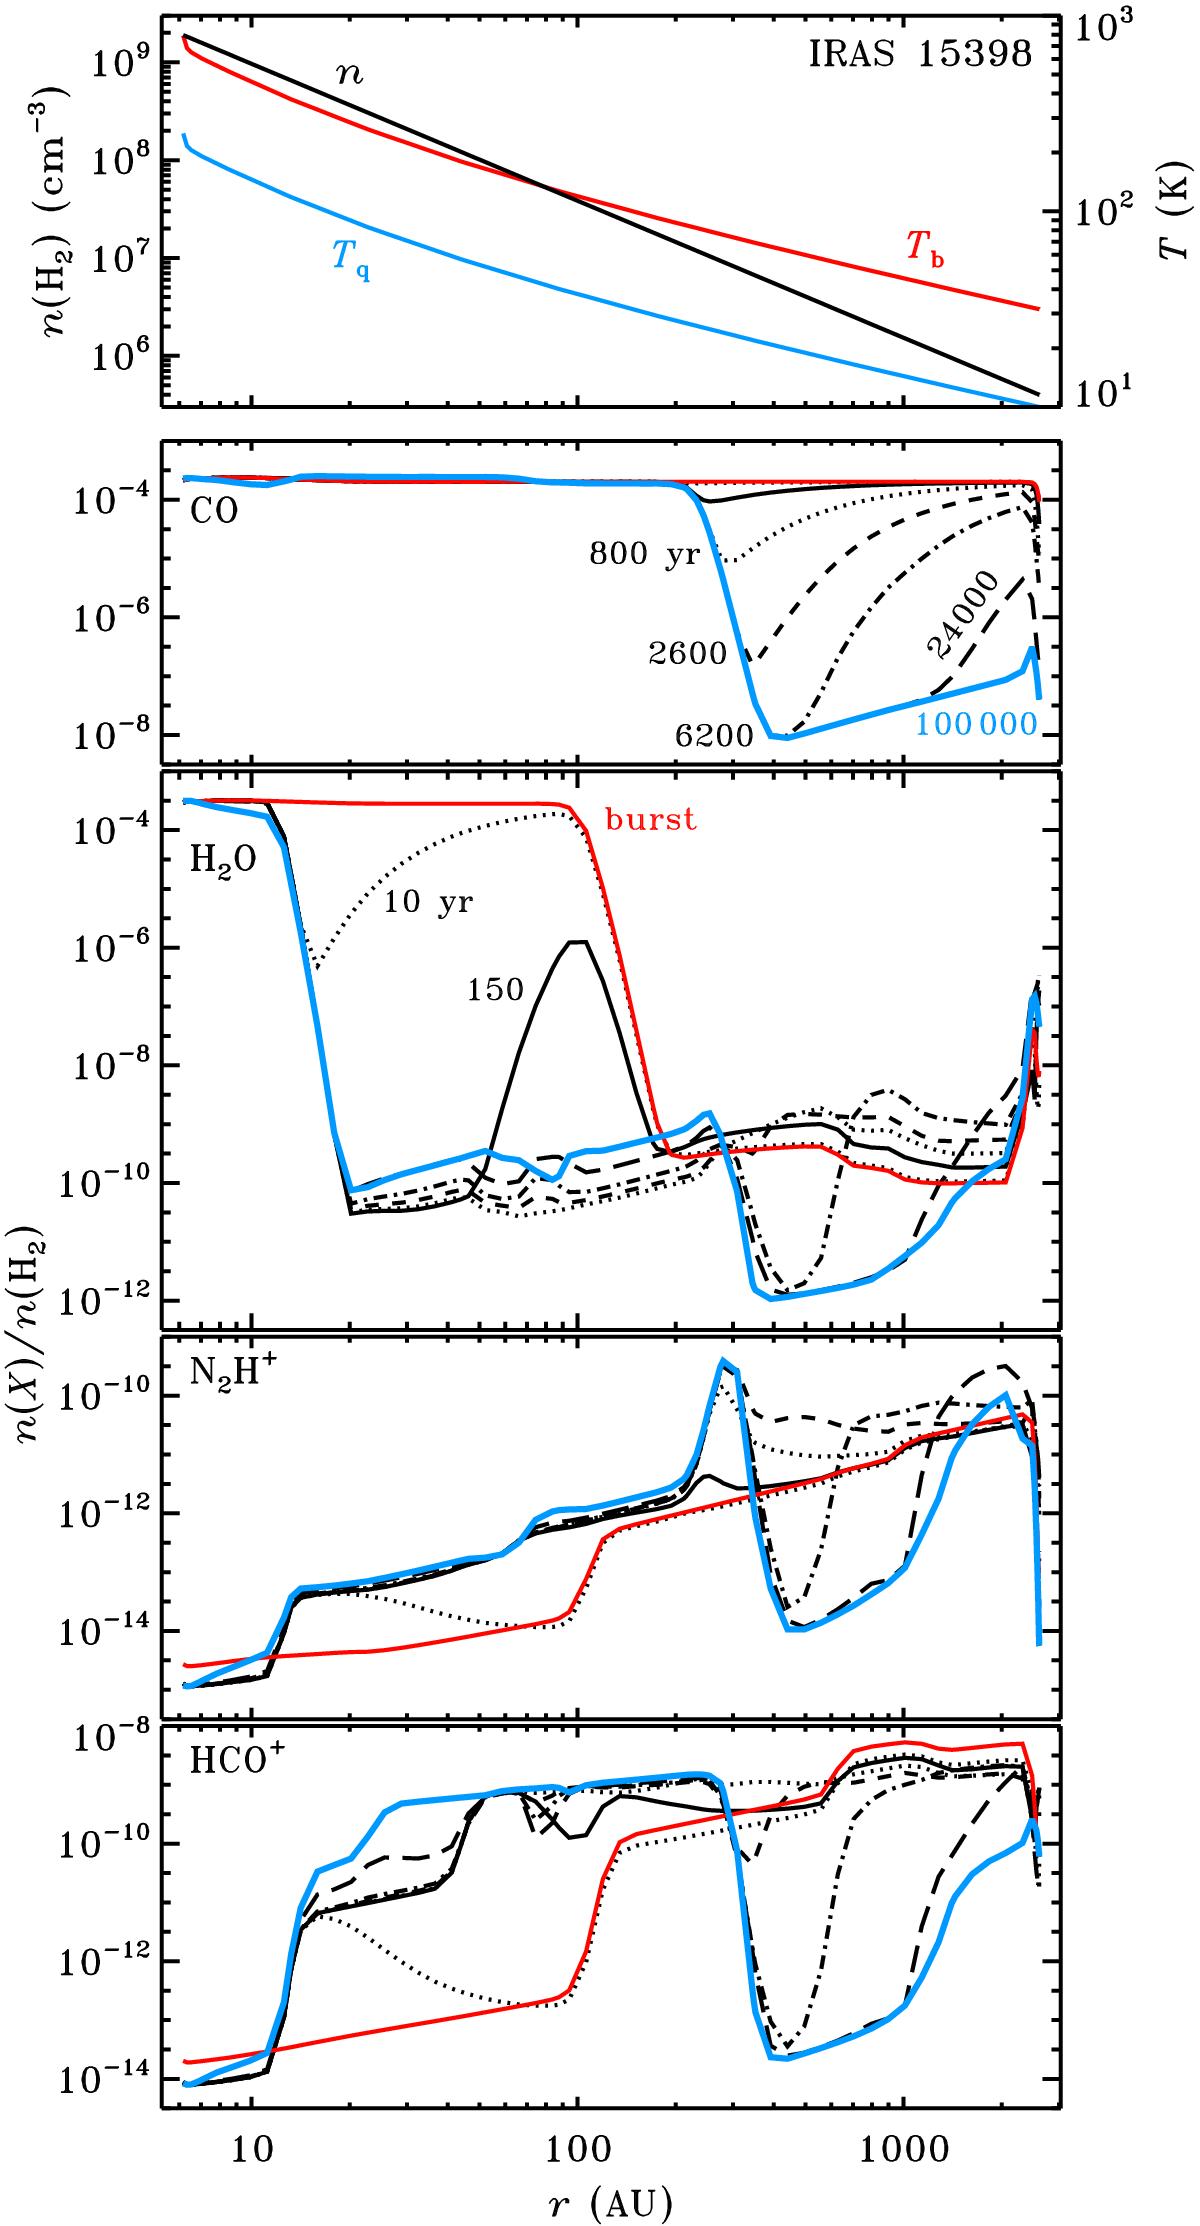
Top panel: radial density profile in IRAS 15398 (black), along with the temperatures in the quiescent phase (blue) and during the burst (red). Other panels: radial abundance profiles of CO, H2O, N2H+, and HCO+. The red curves are during the accretion burst. The black curves are during the quiescent phase, at increasing amounts of time after the burst: 10 yr (dotted), 150 yr (solid), 800 yr (dotted), 2600 yr (short-dashed), 6200 yr (dash-dotted), and 24 000 yr (long-dashed). The quiescent profiles culminate in the blue curve at 1 × 10⁵ yr after the burst.
Current usage metrics show cumulative count of Article Views (full-text article views including HTML views, PDF and ePub downloads, according to the available data) and Abstracts Views on Vision4Press platform.
Data correspond to usage on the plateform after 2015. The current usage metrics is available 48-96 hours after online publication and is updated daily on week days.
Initial download of the metrics may take a while.