Fig. 5
Model results for the time-evolution of the abundance of PAHs (![]() C66Hn), cages (C
C66Hn), cages (C![]() , C
, C![]() , C
, C![]() C
C![]() , C
, C![]() , C
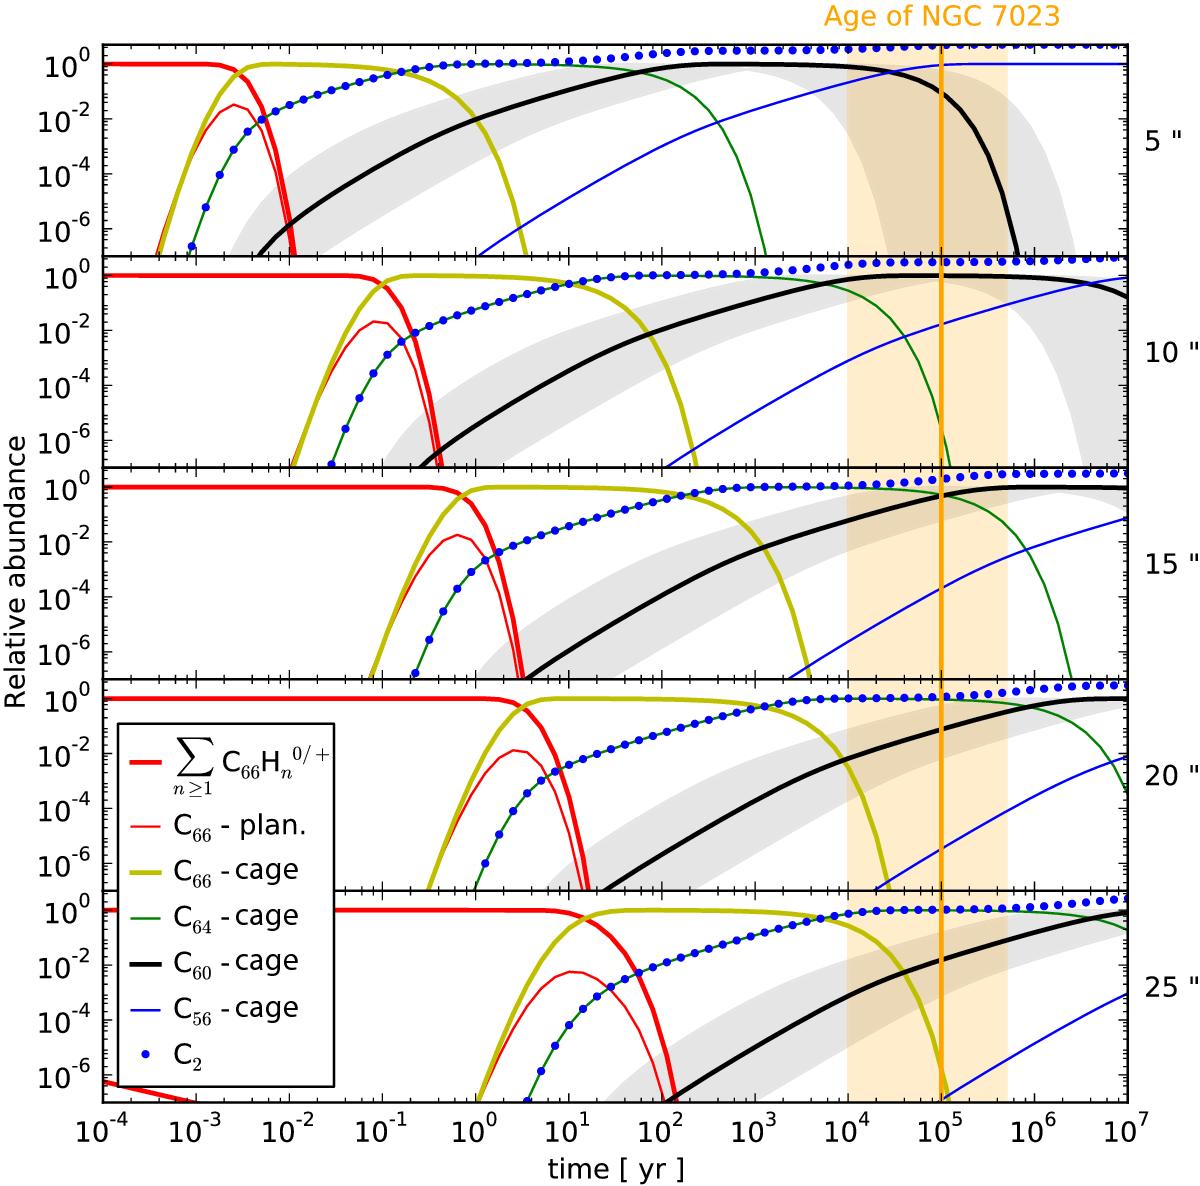
, C![]() ), and C2. These are normalized to the abundance of C66H20 at t = 0. The model calculations are made for distances of 5, 10, 15, 20, and 25′′ from the star HD 200775 in NGC 7023. Note that the dissociation of C2 is not treated in our model, hence the C2 abundances reported are only provided as an indication of how much C2 is formed from the dissociation of cages. Similarly, the dissociation of the C
), and C2. These are normalized to the abundance of C66H20 at t = 0. The model calculations are made for distances of 5, 10, 15, 20, and 25′′ from the star HD 200775 in NGC 7023. Note that the dissociation of C2 is not treated in our model, hence the C2 abundances reported are only provided as an indication of how much C2 is formed from the dissociation of cages. Similarly, the dissociation of the C![]() is not included in the model and therefore its abundance is provided as an indication of how much C60 is being destroyed. The grey shadowed regions indicate the uncertainty range implied by uncertainties of a factor of 10 on the rates of C2 loss (see Sect. 4.3 for details). The approximate age of NGC 7023 is given, with orange shadowed regions representing the uncertainty on this value (see Sect. 3 for details).
is not included in the model and therefore its abundance is provided as an indication of how much C60 is being destroyed. The grey shadowed regions indicate the uncertainty range implied by uncertainties of a factor of 10 on the rates of C2 loss (see Sect. 4.3 for details). The approximate age of NGC 7023 is given, with orange shadowed regions representing the uncertainty on this value (see Sect. 3 for details).
Current usage metrics show cumulative count of Article Views (full-text article views including HTML views, PDF and ePub downloads, according to the available data) and Abstracts Views on Vision4Press platform.
Data correspond to usage on the plateform after 2015. The current usage metrics is available 48-96 hours after online publication and is updated daily on week days.
Initial download of the metrics may take a while.