Fig. 3
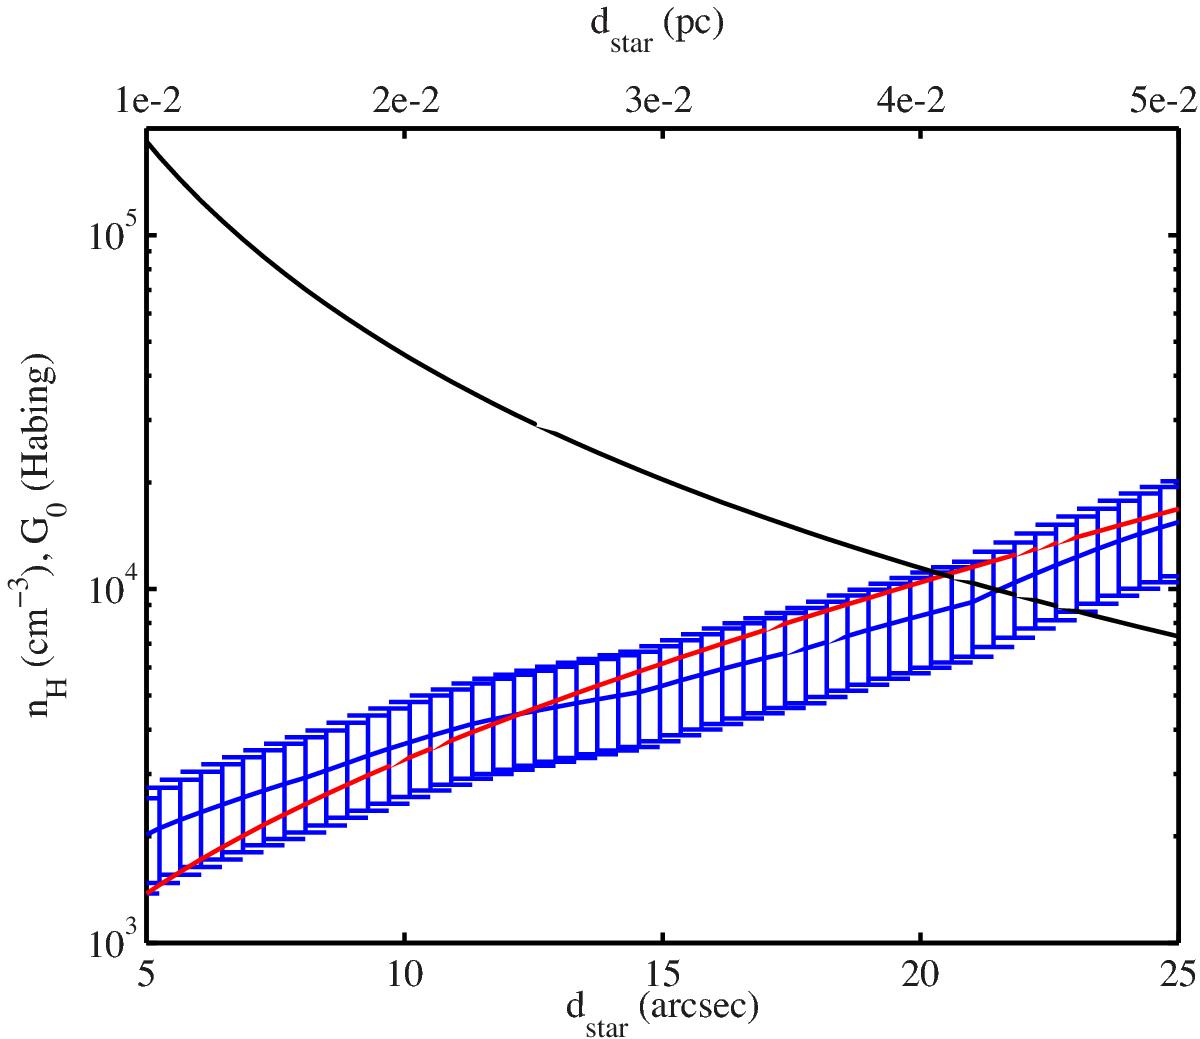
Physical conditions in NGC 7023. Density profile derived from observations of the far-infrared dust emission in the cavity of NGC 7023 (blue with error-bars) and exponential fit to this profile used in the photochemical model (red line). The black line shows the adopted profile for the intensity of the radiation field G0.
Current usage metrics show cumulative count of Article Views (full-text article views including HTML views, PDF and ePub downloads, according to the available data) and Abstracts Views on Vision4Press platform.
Data correspond to usage on the plateform after 2015. The current usage metrics is available 48-96 hours after online publication and is updated daily on week days.
Initial download of the metrics may take a while.