Fig. 8
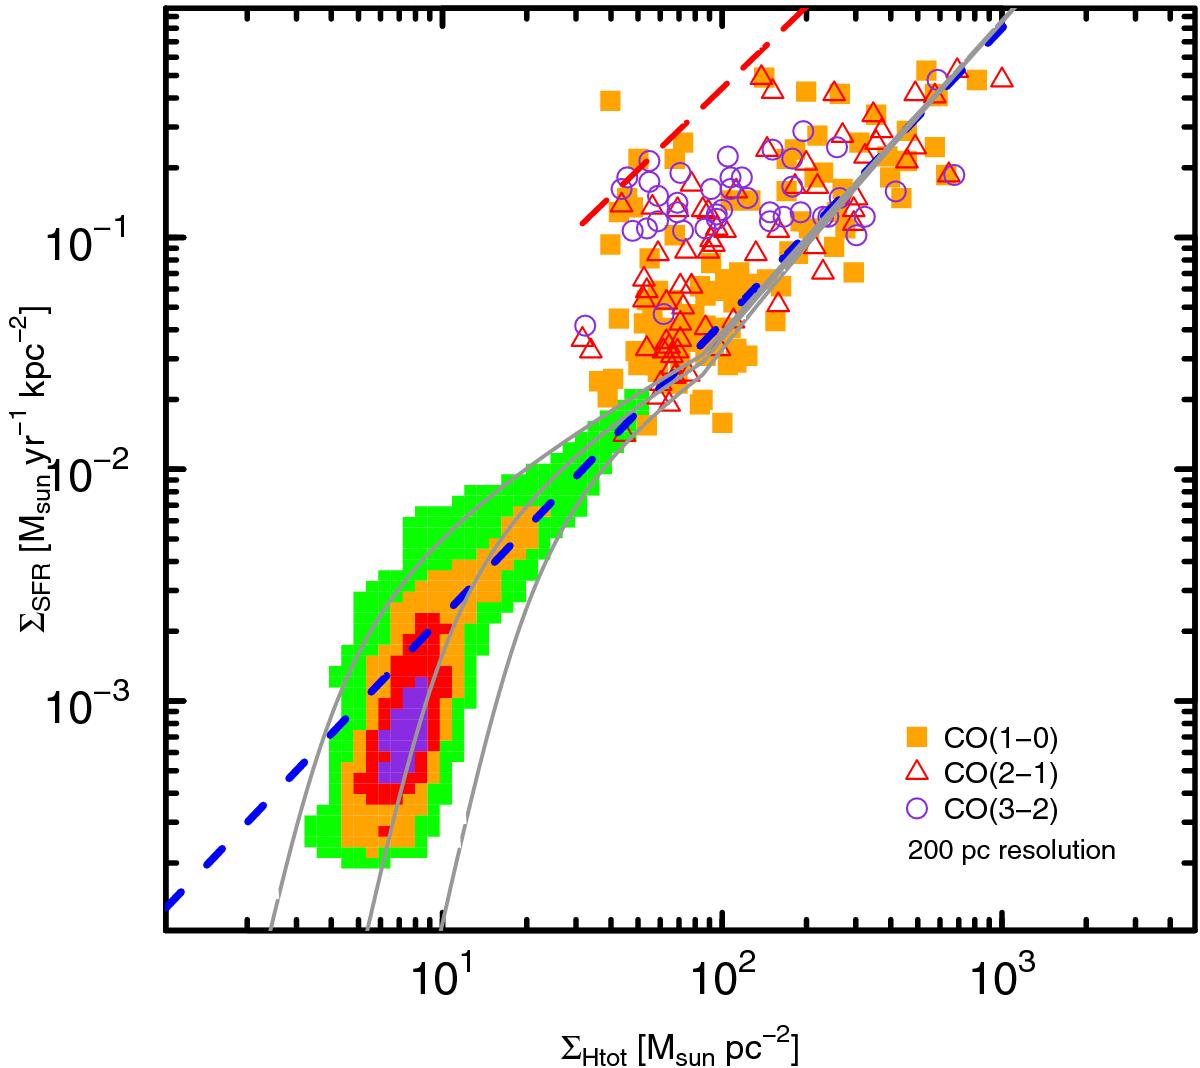
Comparison between (i) the K-S relation plot derived for all sample galaxies and taking all the 12CO emission lines at the common resolution of 200 pc into account, as shown in Fig. 7; and (ii) results from Bigiel et al. (2008). The model predictions from Krumholz et al. (2009) are also shown with solar metallicity and clumping factor c = 1, 2, and 5; see Krumholz et al. (2009) for more details. Also shown (as a blue short-dashed line) is the trend for star-forming galaxies and mergers found by Genzel et al. (2010) using a common conversion factor αCO (=3.2 M⊙ pc-2 (K km s-1)-1). The horizontal axis has been adjusted to our αCO (=3.5 M⊙ pc-2 (K km s-1)-1) and our non-inclusion of helium. We have also plotted the merger/starburst trend by Genzel et al. (2010) (with αCO = 1 M⊙ pc-2 (K km s-1)-1) as shown by a (red) long-dashed line.
Current usage metrics show cumulative count of Article Views (full-text article views including HTML views, PDF and ePub downloads, according to the available data) and Abstracts Views on Vision4Press platform.
Data correspond to usage on the plateform after 2015. The current usage metrics is available 48-96 hours after online publication and is updated daily on week days.
Initial download of the metrics may take a while.