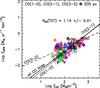
Fig. 7
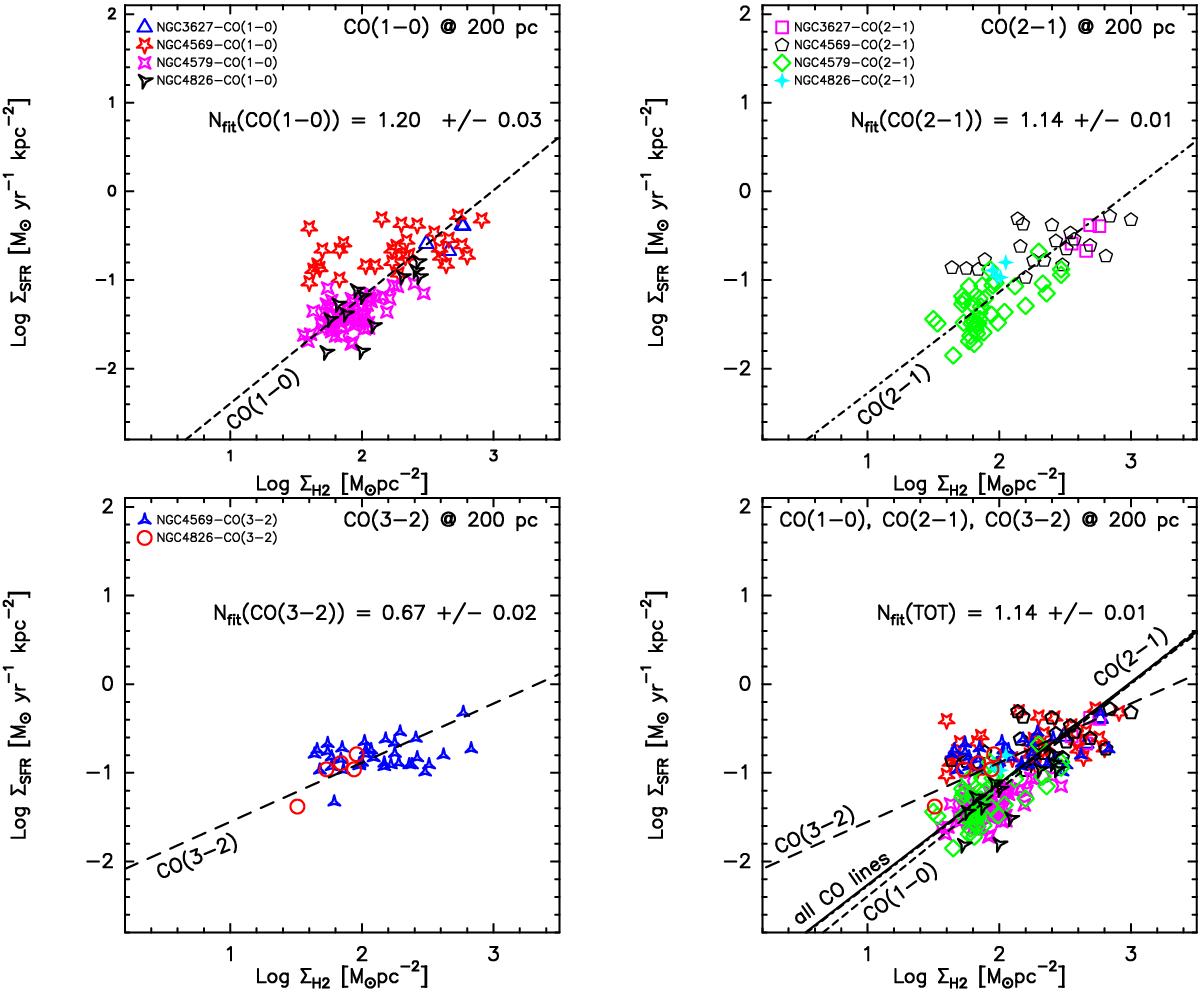
K-S relation plot for all sample galaxies. The top left panel plots all galaxies and only 12CO(1−0) emission line data; the top right panel all galaxies and only 12CO(2−1) emission line data; the bottom left panel all galaxies and only 12CO(3−2) emission line data; and the bottom right panel all galaxies and all the available 12CO emission line data, at the common spatial resolution of 200 pc. Different symbols and/or colors indicate galaxies whose ΣH2 has been derived from a given 12CO transition, as shown in the labels. The black lines refer to the OLS fits derived for different cases: the short-dotted line is for all galaxies and 12CO(1−0) emission line data, the point-dotted line for all galaxies and 12CO(2−1), the long-dotted line for all galaxies and 12CO(3−2), and the black solid line is for all galaxies and all the available 12CO lines. In the bottom right panel the 12CO(2−1) OLS fit line is hidden by total OLS fit line.
Current usage metrics show cumulative count of Article Views (full-text article views including HTML views, PDF and ePub downloads, according to the available data) and Abstracts Views on Vision4Press platform.
Data correspond to usage on the plateform after 2015. The current usage metrics is available 48-96 hours after online publication and is updated daily on week days.
Initial download of the metrics may take a while.