Fig. 2
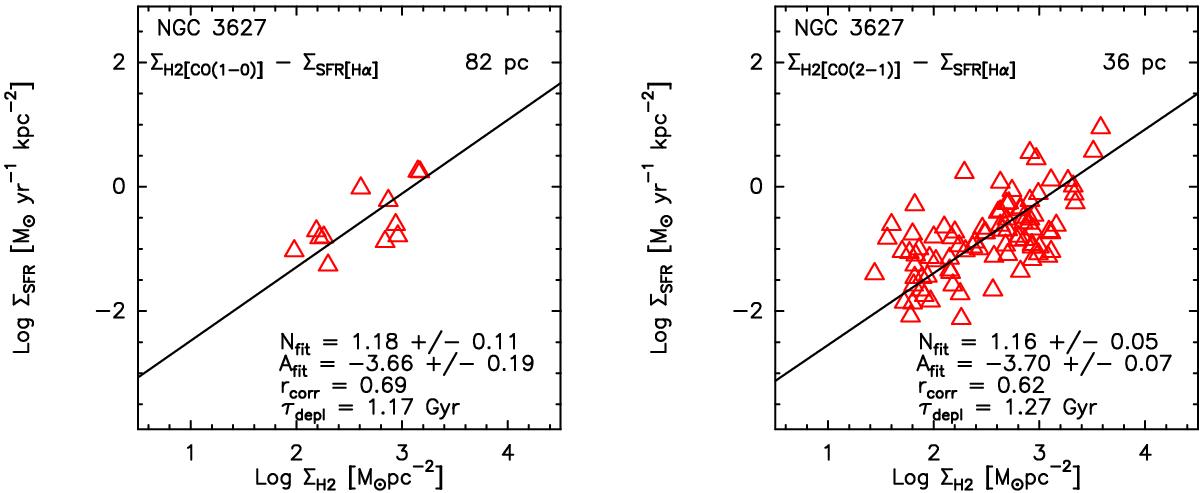
Left panel: K-S relation plot for NGC 3627 at the resolution of 82 pc. ΣH2 was derived from the 12CO(1−0) emission line map and ΣSFR from the Hα image based on Eqs. (2) and (5), respectively. Red triangles indicate data points above 3σ significance both in ΣH2 and ΣSFR, within a radius of 1.3 kpc (on the plane of the galaxy). The solid black line indicates the OLS bisector fitting line (see Sect. 3.7 for fitting method). The index Nfit and the intercept Afit of the OLS bisector fitting line, the Pearson correlation coefficient rcore, and τdepl values are reported in figure. Right panel: same as left panel with ΣH2 derived from the 12CO(2−1) emission line map based on Eq. (3) at the resolution of 36 pc. Red triangles indicate data points above 3σ significance both in ΣH2 and ΣSFR, within a radius of 1.1 kpc (on the plane of the galaxy).
Current usage metrics show cumulative count of Article Views (full-text article views including HTML views, PDF and ePub downloads, according to the available data) and Abstracts Views on Vision4Press platform.
Data correspond to usage on the plateform after 2015. The current usage metrics is available 48-96 hours after online publication and is updated daily on week days.
Initial download of the metrics may take a while.