Fig. 1
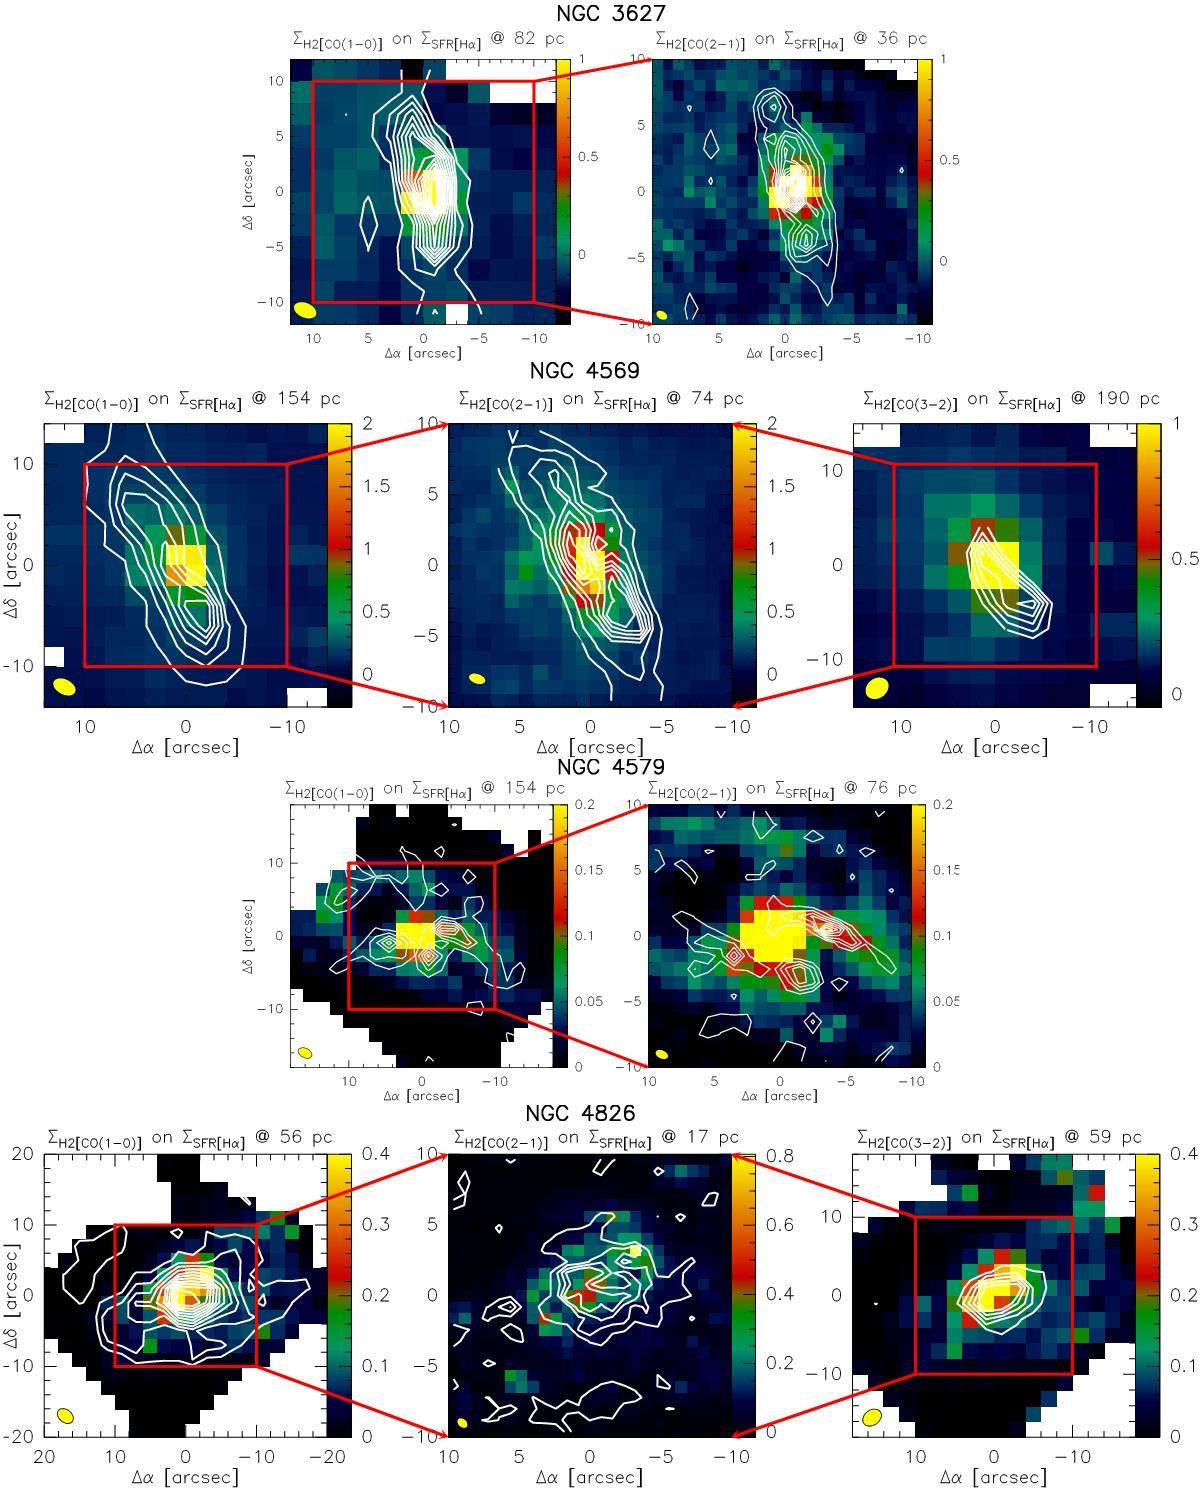
ΣH2 contours in M⊙ pc-2 derived from 12CO(1−0), 12CO(2−1), and 12CO(3−2) overlaid on ΣSFR images in M⊙ yr-1 kpc-2 at the intrinsic spatial resolution of the 12CO data and with pixel sizes equal to the 12CO resolution. The beams are plotted (in yellow) in the lower left corners of maps and their values are listed in Table 2. (Δα, Δδ)-offsets are with respect to the dynamical center of each galaxy. ΣH2 contours are drawn starting from noise levels >3σ with contour spacings that are whole multiples of >3σ.
Current usage metrics show cumulative count of Article Views (full-text article views including HTML views, PDF and ePub downloads, according to the available data) and Abstracts Views on Vision4Press platform.
Data correspond to usage on the plateform after 2015. The current usage metrics is available 48-96 hours after online publication and is updated daily on week days.
Initial download of the metrics may take a while.