Fig. 1
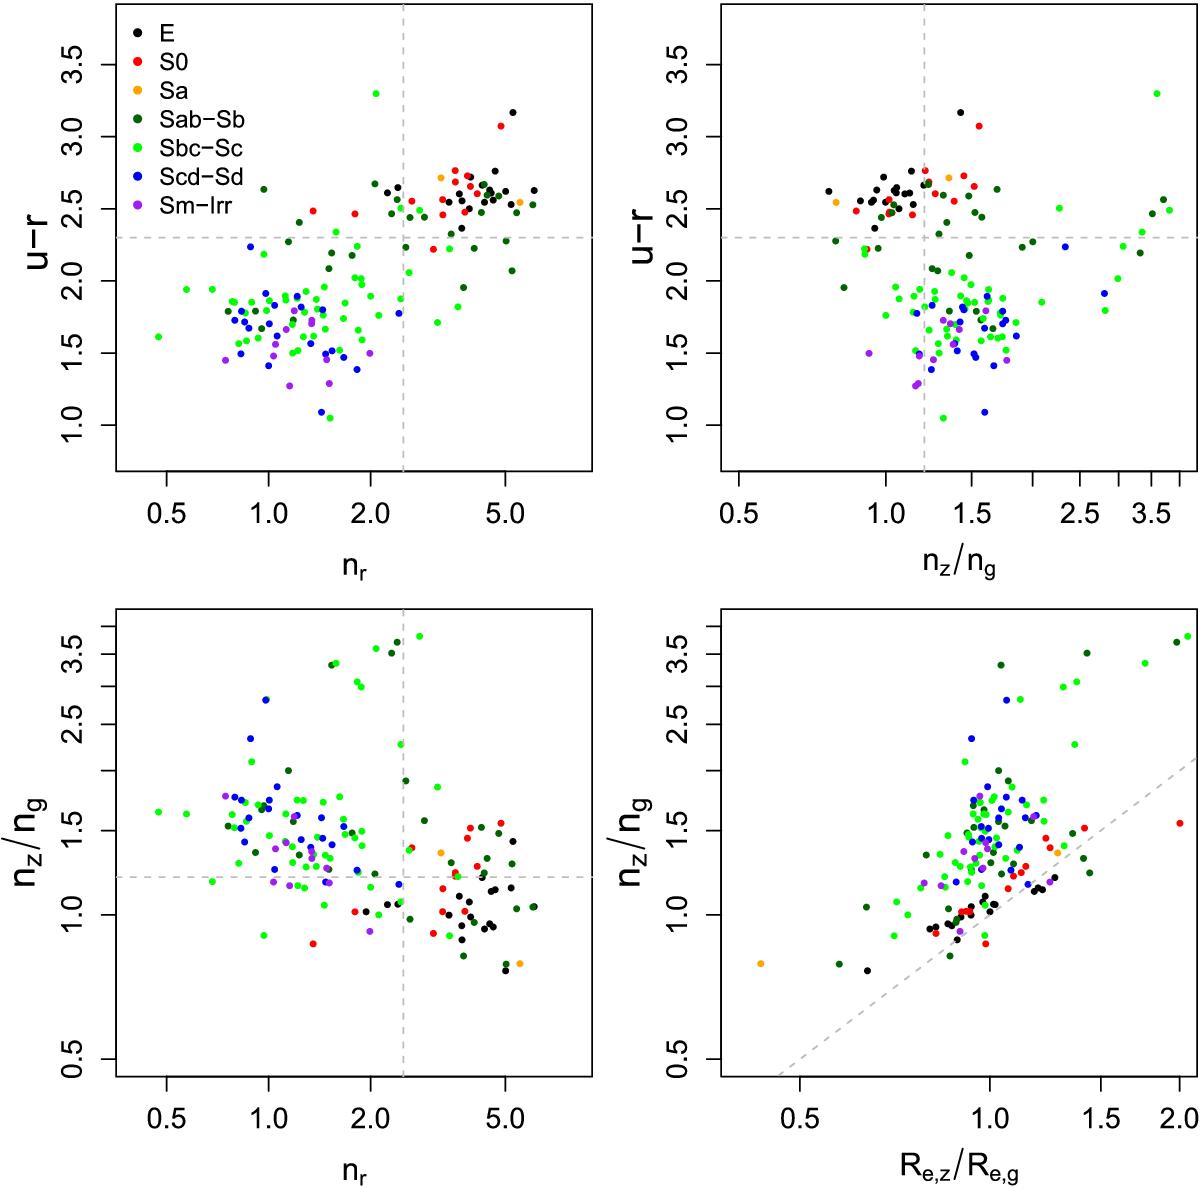
Original images. Top-left panel: u − r colour versus the Sérsic index in r-band. Top-right panel: u − r colour versus ![]() . Bottom-left panel:
. Bottom-left panel: ![]() versus
versus ![]() . Bottom-right panel:
. Bottom-right panel: ![]() versus
versus ![]() . All the parameters have been derived with multi-band fitting with the use of galfitm. The dashed lines are in the following values: u − r = 2.3, nr = 2.5 and
. All the parameters have been derived with multi-band fitting with the use of galfitm. The dashed lines are in the following values: u − r = 2.3, nr = 2.5 and ![]() = 1.2. In the bottom-right panel we plot the 1:1 line.
= 1.2. In the bottom-right panel we plot the 1:1 line.
Current usage metrics show cumulative count of Article Views (full-text article views including HTML views, PDF and ePub downloads, according to the available data) and Abstracts Views on Vision4Press platform.
Data correspond to usage on the plateform after 2015. The current usage metrics is available 48-96 hours after online publication and is updated daily on week days.
Initial download of the metrics may take a while.