Fig. 3
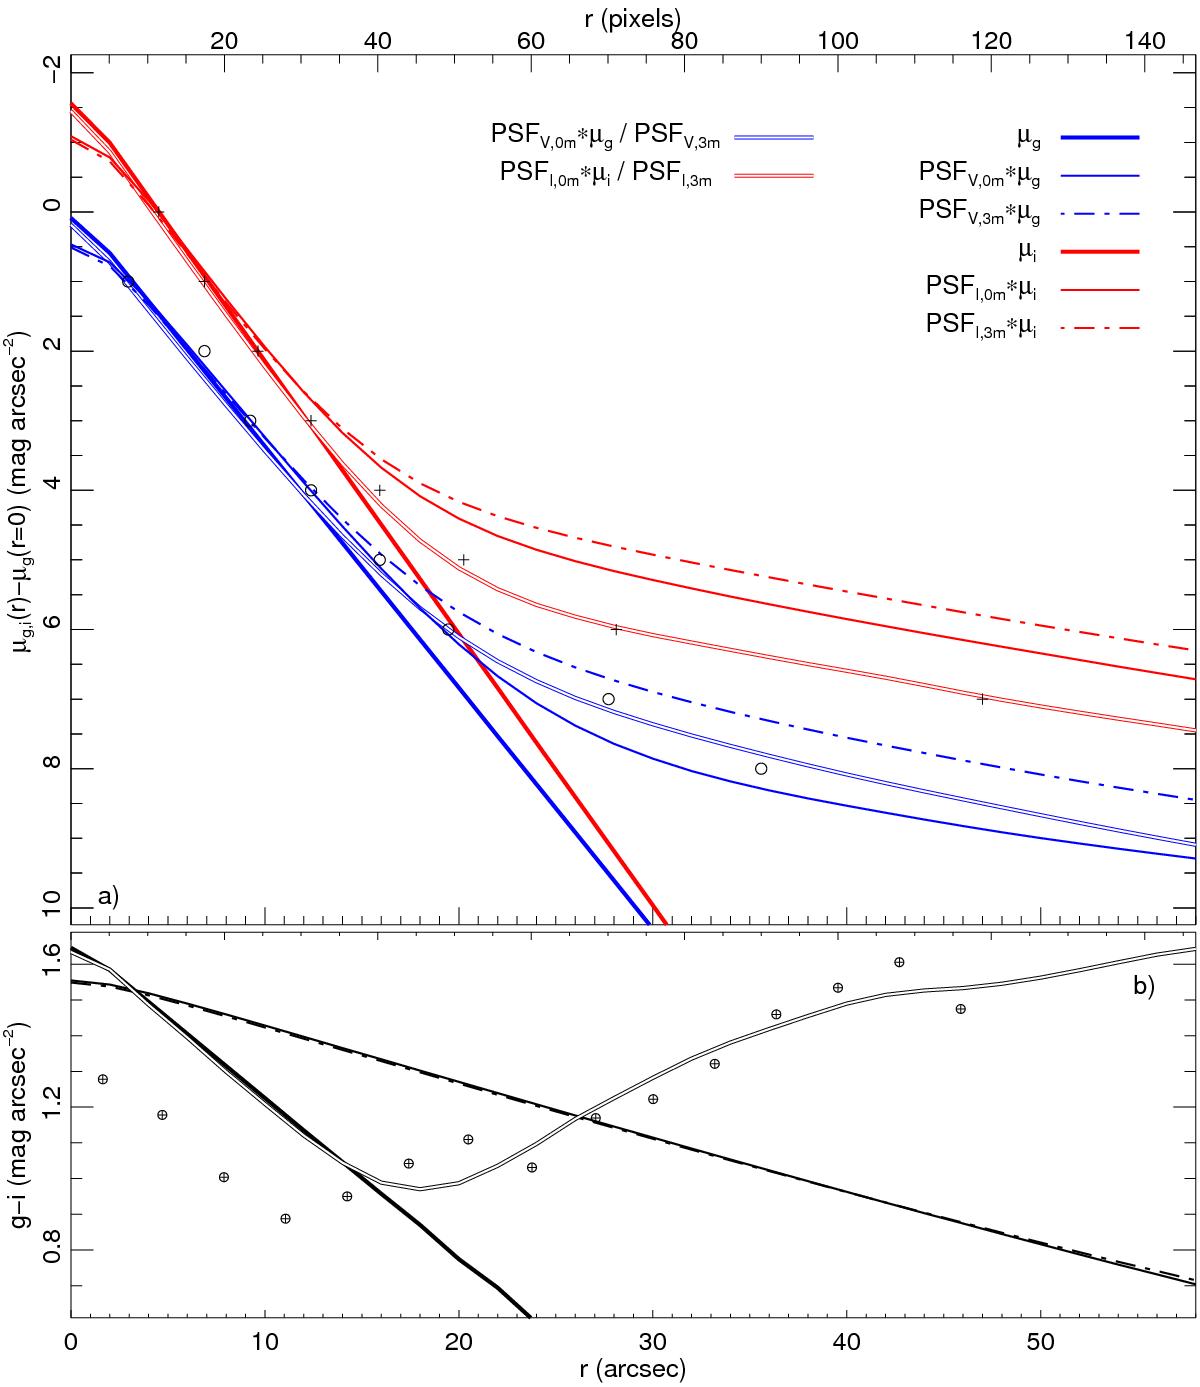
Minor-axis g- and i-band surface-brightness profiles versus the vertical distance z of the LSBG model. Panels and lines are as described in Fig. 2. Circles (crosses) indicate measured values of the g band (i band; BZC10). In panel a), the blue and the red solid lines that are overstriked with a white solid line show the PSF-affected input model. In panel b), the corresponding g − i colour measurements are shown with crossed circles, and the thick overstriked line shows the colour of the PSF-affected model.
Current usage metrics show cumulative count of Article Views (full-text article views including HTML views, PDF and ePub downloads, according to the available data) and Abstracts Views on Vision4Press platform.
Data correspond to usage on the plateform after 2015. The current usage metrics is available 48-96 hours after online publication and is updated daily on week days.
Initial download of the metrics may take a while.