Fig. E.3
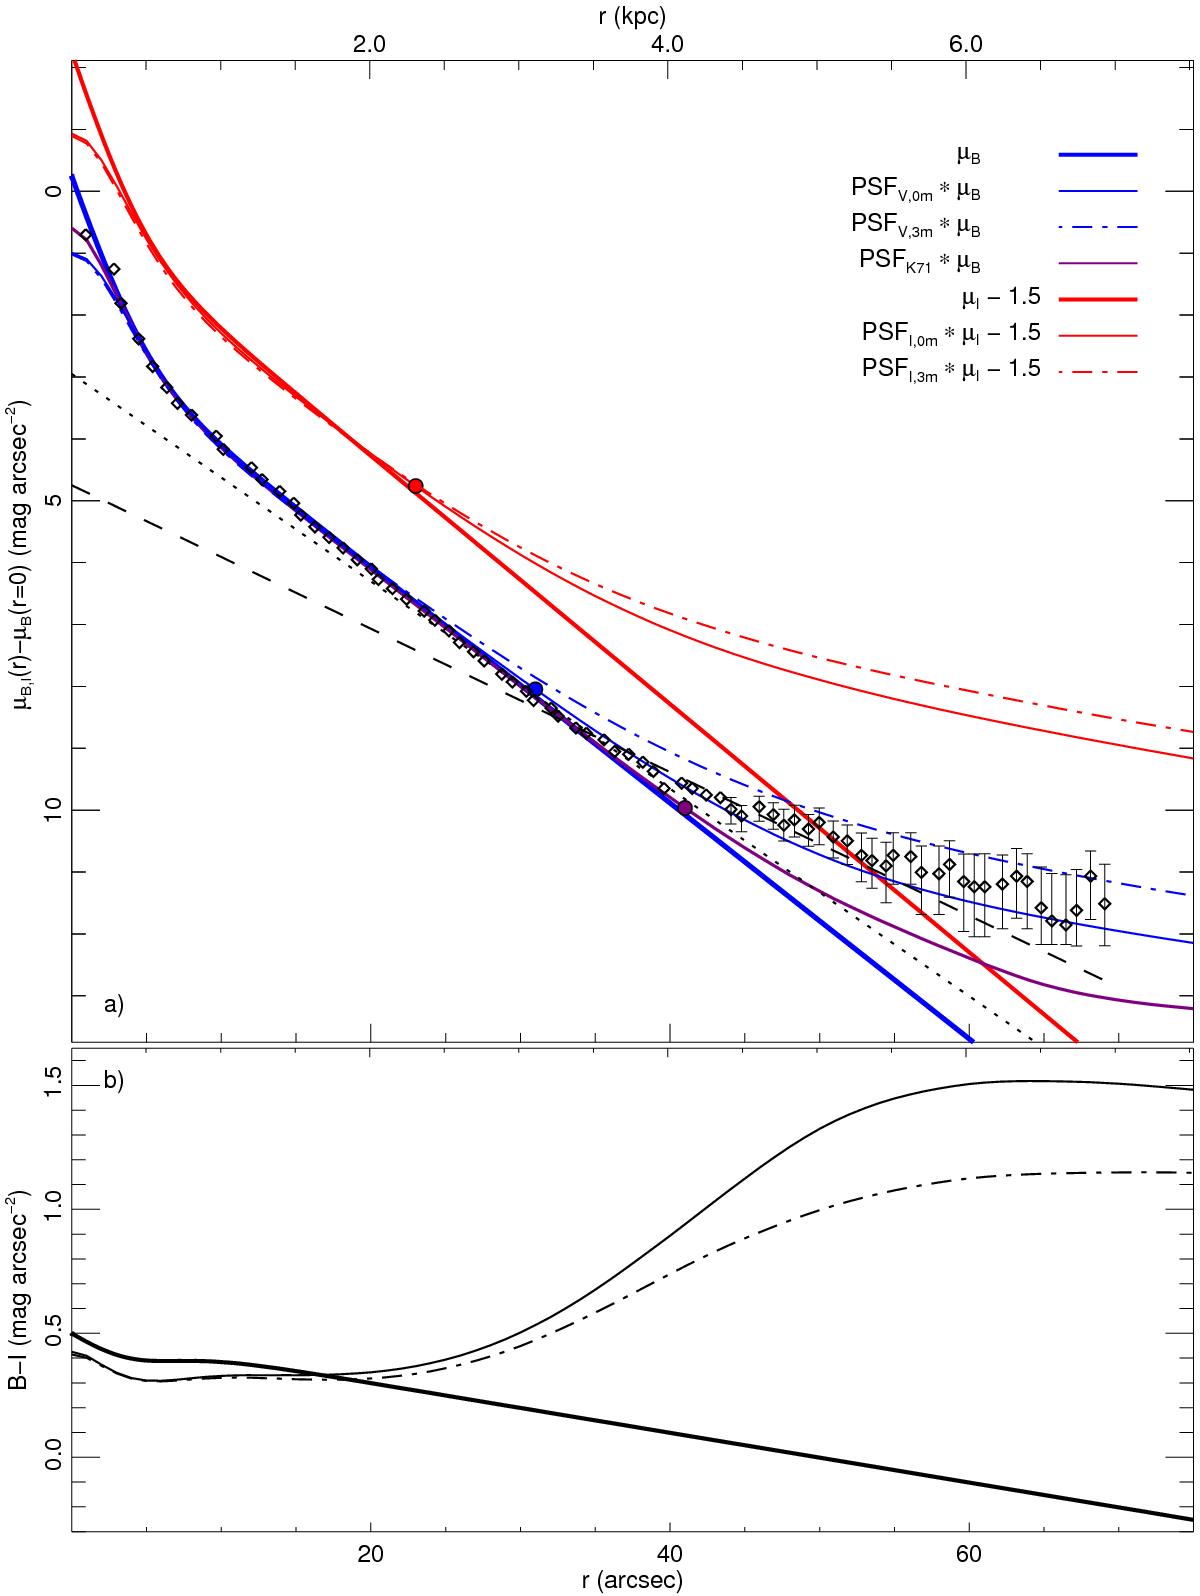
Surface-brightness profiles versus radius for the BCG UM 465. Panels, lines, and coloured bullets are as described in Fig. 2. The I-band profiles are offset by −1.5 mag arcsec-2 from the B-band profiles for increased visibility. Diamonds and error bars mark measured B-band values of M13b. The dotted (dashed) line shows the best-fit exponential model fit of M13b for 24 ≤ μB ≤ 26 (26 ≤ μB ≤ 28) mag arcsec-2.
Current usage metrics show cumulative count of Article Views (full-text article views including HTML views, PDF and ePub downloads, according to the available data) and Abstracts Views on Vision4Press platform.
Data correspond to usage on the plateform after 2015. The current usage metrics is available 48-96 hours after online publication and is updated daily on week days.
Initial download of the metrics may take a while.