Fig. 2
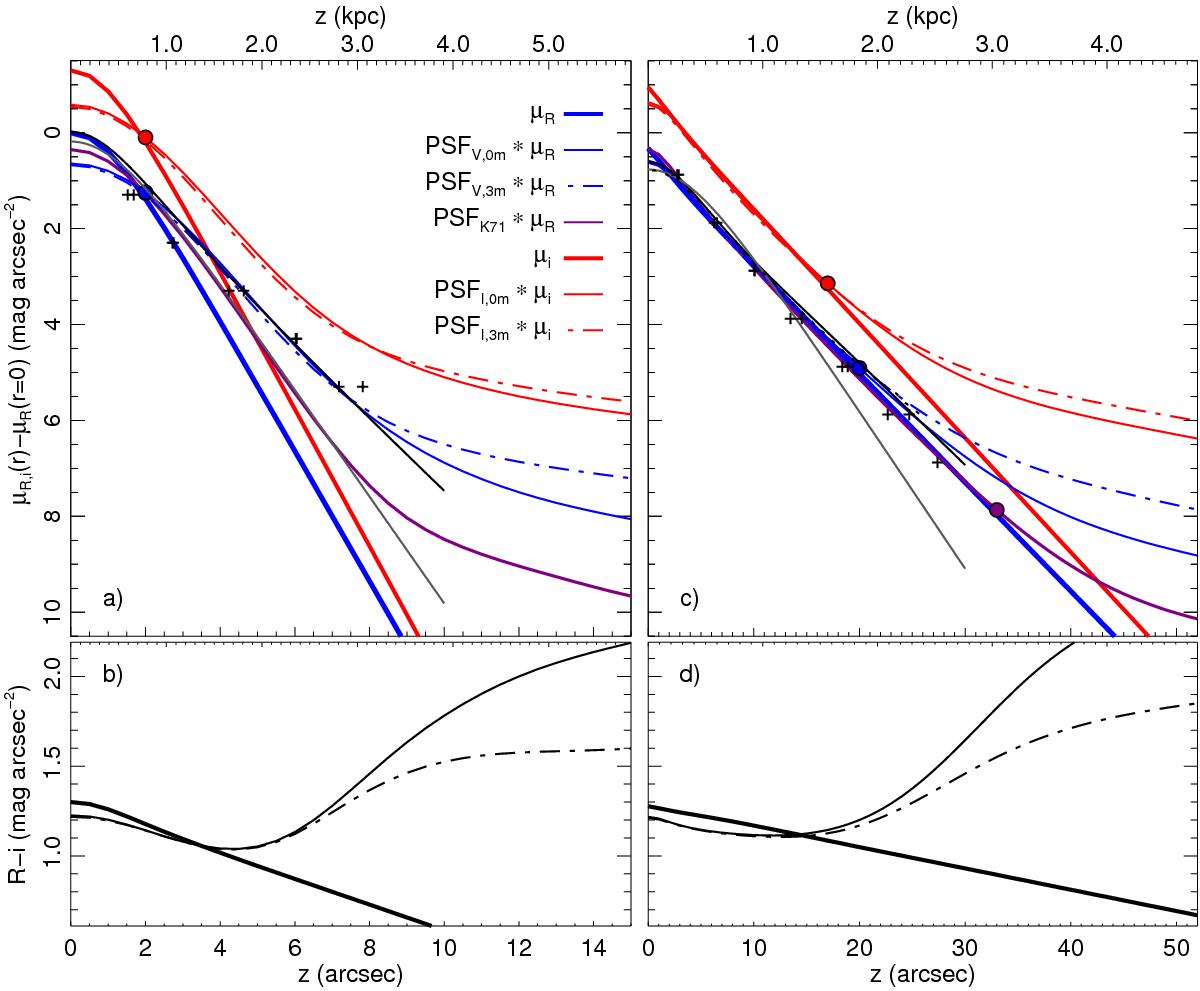
Minor-axis surface-brightness profiles versus the vertical distance z for two edge-on disc galaxies. a) and b) FGC 310, and c) and d) FGC 1285. Blue and purple lines in panels a) and c) show R-band profiles, and red lines i-band profiles. Model profiles are drawn with thick solid lines. Solid (dash-dotted) lines are profiles of convolved models using PSFV,0m and PSFi,0m (PSFV,3m and PSFi,3m), the purple line used PSFK71. The black (grey) line shows the respective fitted combined thin-and-thick-disc model (single-disc model; of YD06). Crosses indicate R-band measurements that were extracted from Fig. 3 in DB00. The lower limiting radius r110 – where the convolved models using PSFV,0m, PSFi,0m, and PSFK71 lie ≥10 per cent above the input model – is marked with a coloured bullet that is surrounded by a black ring. b) Three colour profiles R − i are shown for: the model (thick solid line), the convolved model using PSFV,0m and PSFi,0m (solid line), and the convolved model using PSFV,3m and PSFi,3m (dash-dotted line).
Current usage metrics show cumulative count of Article Views (full-text article views including HTML views, PDF and ePub downloads, according to the available data) and Abstracts Views on Vision4Press platform.
Data correspond to usage on the plateform after 2015. The current usage metrics is available 48-96 hours after online publication and is updated daily on week days.
Initial download of the metrics may take a while.