Fig. C.3
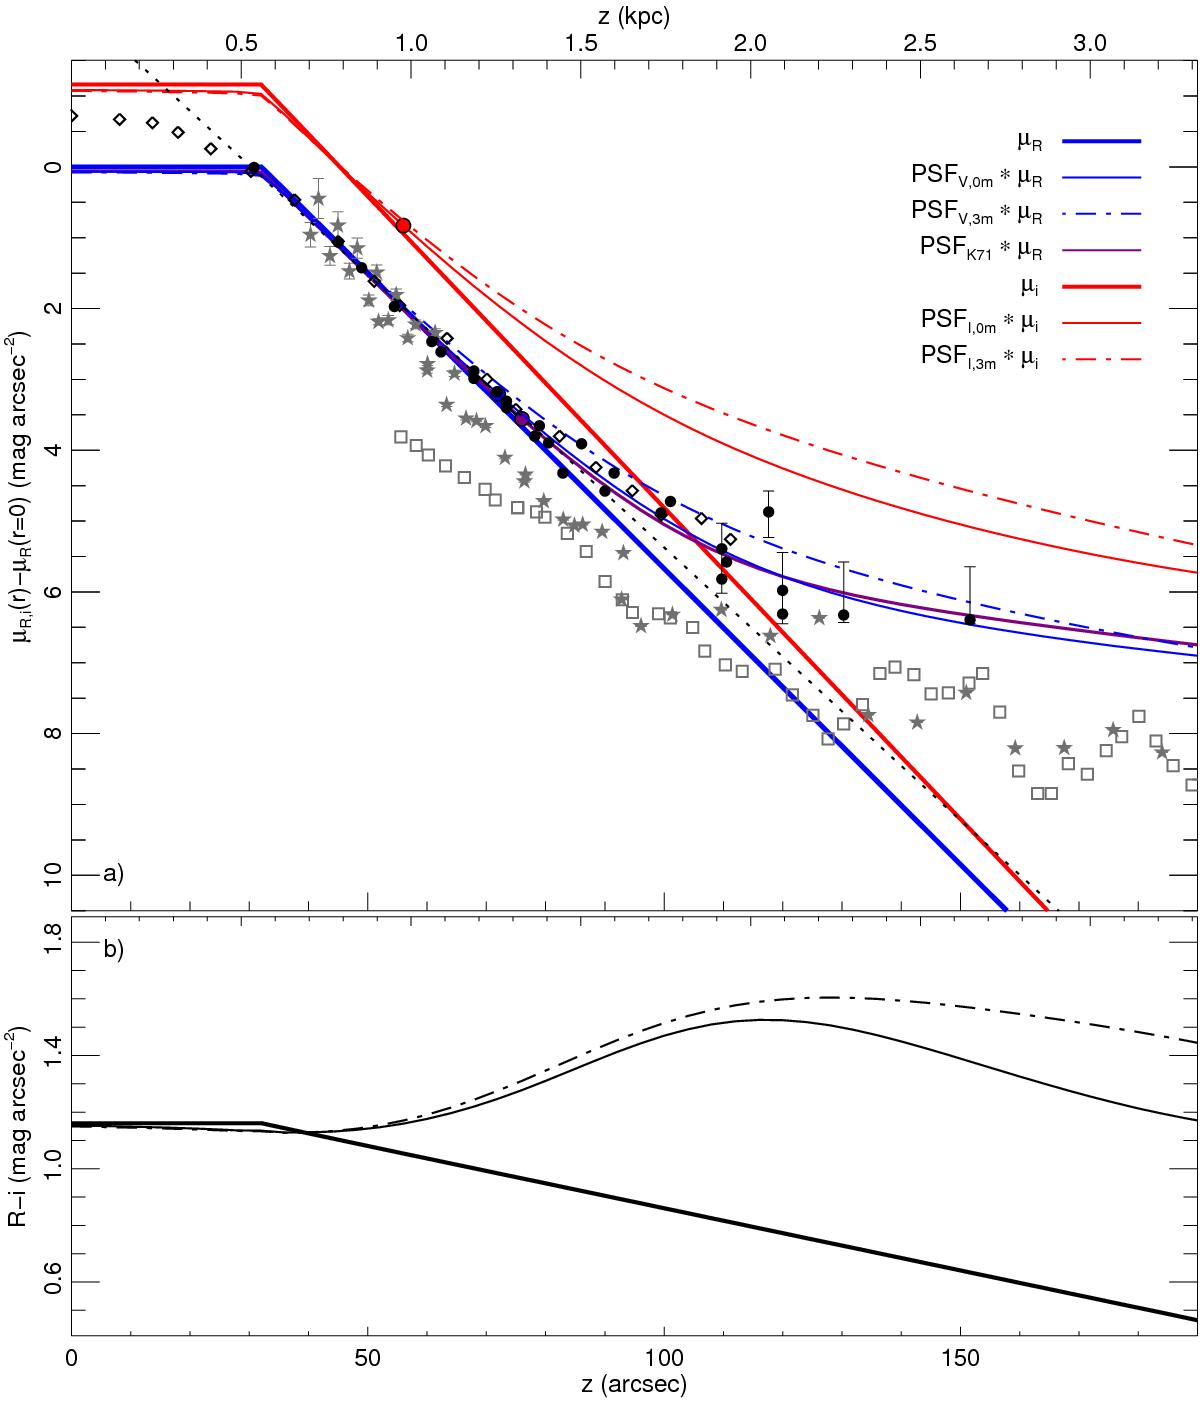
Minor-axis surface-brightness profiles versus the vertical distance
z
for the edge-on disc galaxy NGC 4244. Panels, lines, and coloured bullets are as
described in Fig. 2. The black bullets and
error bars (diamonds) in panel a) show measured R-band
(J-band) values of F99 (KS81a). The grey boxes
and stars show scaled single-star measurements derived from HST star counts of
Tikhonov & Galazutdinova (2005) and
Streich et al. (in prep.), respectively; the values of the latter reference are
only shown for z>
40″. The best-fit profile of F99
(![]() ) is shown with a black dotted
line.
) is shown with a black dotted
line.
Current usage metrics show cumulative count of Article Views (full-text article views including HTML views, PDF and ePub downloads, according to the available data) and Abstracts Views on Vision4Press platform.
Data correspond to usage on the plateform after 2015. The current usage metrics is available 48-96 hours after online publication and is updated daily on week days.
Initial download of the metrics may take a while.