Fig. C.1
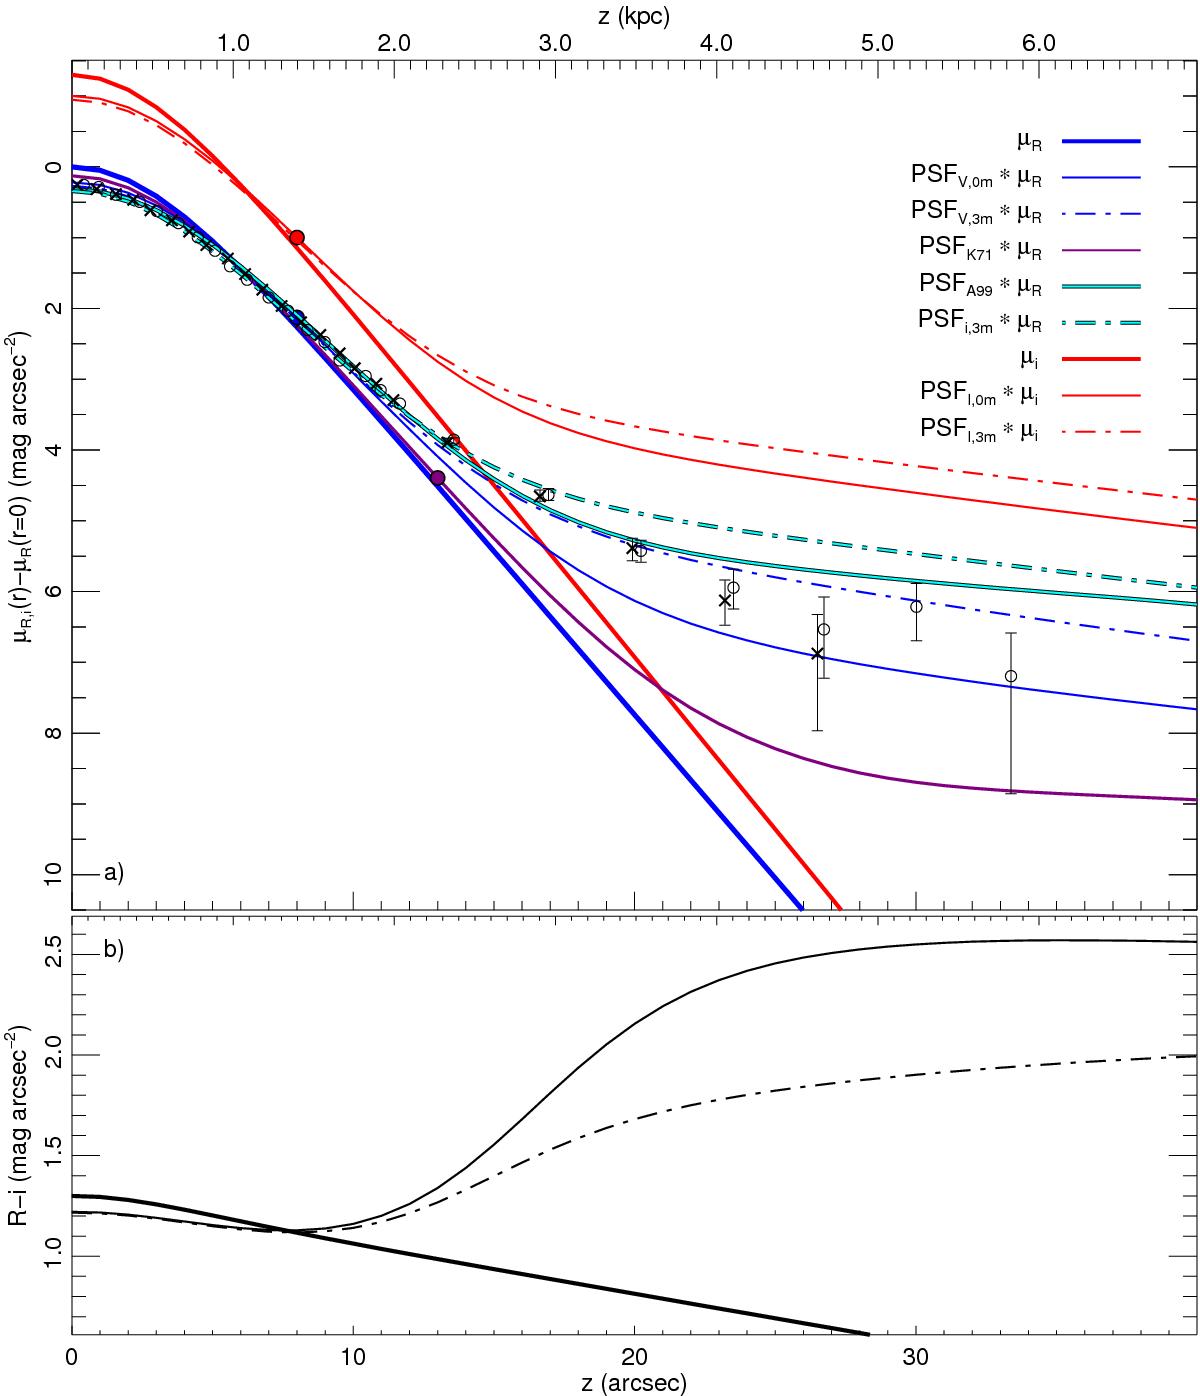
Minor-axis R-band and i-band surface-brightness profiles versus the vertical distance z of models and measurements of the edge-on galaxy IC 5249. Panels, lines, and coloured bullets are as described in Fig. 2. The R-band model was additionally convolved with PSFA99 (PSFi,3m) to produce the cyan-coloured solid (dash-dotted) line with a black border in panel a). Crosses, circles, and error bars in the same panel show region-B measurements for cuts on either side of the disc of ABC99.
Current usage metrics show cumulative count of Article Views (full-text article views including HTML views, PDF and ePub downloads, according to the available data) and Abstracts Views on Vision4Press platform.
Data correspond to usage on the plateform after 2015. The current usage metrics is available 48-96 hours after online publication and is updated daily on week days.
Initial download of the metrics may take a while.