Fig. 1
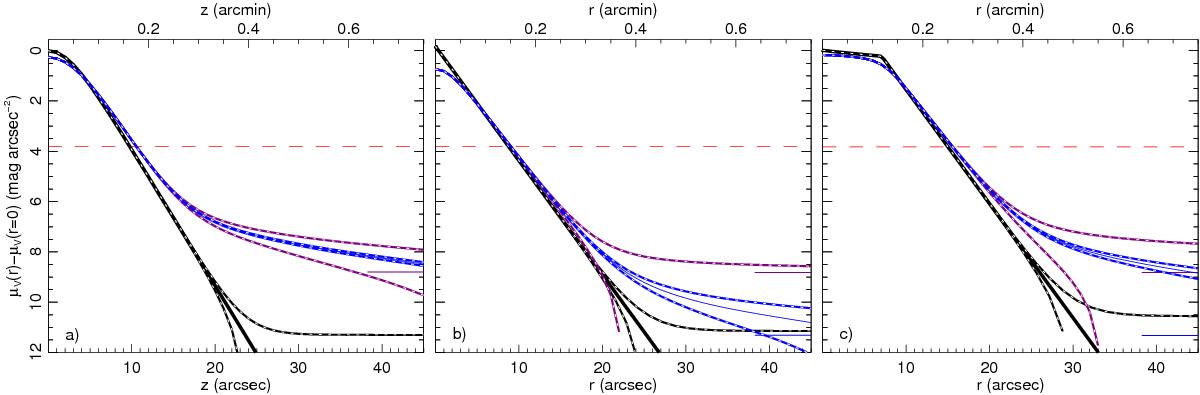
Surface-brightness profiles of the three intermediate-size example models, which illustrate effects of the accuracy of the sky subtraction using PSFV,0m. The three panels show the: a) edge-on disc galaxy (intensities are drawn versus the vertical distance z instead of the radius r), b) Sérsic-type galaxy; and c) face-on disc galaxy. In each panel, the galaxy model profile is drawn with a thick black solid line, and the convolved model profile is drawn with a thin blue line. The horizontal dashed red lines indicate the used background level of the sky, and the purple and blue short horizontal lines on the right-hand side of each panel 0.01 and 0.001 times the sky level. The thick lines overplotted with white dotted lines indicate the resulting profiles when the sky is under or over subtracted by 0.1 per cent (black and blue lines) and 1 per cent (purple lines).
Current usage metrics show cumulative count of Article Views (full-text article views including HTML views, PDF and ePub downloads, according to the available data) and Abstracts Views on Vision4Press platform.
Data correspond to usage on the plateform after 2015. The current usage metrics is available 48-96 hours after online publication and is updated daily on week days.
Initial download of the metrics may take a while.