Fig. 5
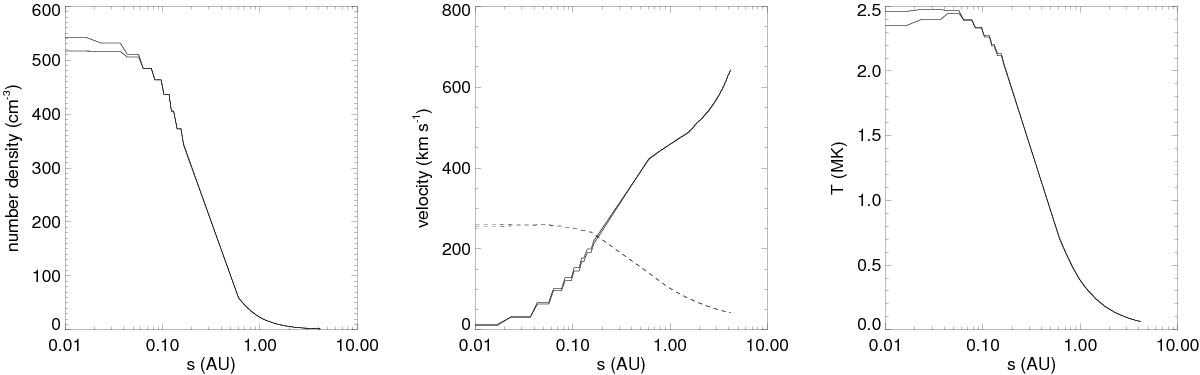
Particle number density (left panel), velocity (middle panel), and temperature (right panel) along the line in the centre of the WWC region (i.e. the dashed red line in Fig. 3) as a function of distance along the line. The two lines in each plot correspond to the two directions from the centre outwards. The dashed lines in the velocity plot show the sound speed along the lines. The increase in wind speed far from the centre of the system is mostly a result of Coriolis forces in the rotating frame of reference of our simulation.
Current usage metrics show cumulative count of Article Views (full-text article views including HTML views, PDF and ePub downloads, according to the available data) and Abstracts Views on Vision4Press platform.
Data correspond to usage on the plateform after 2015. The current usage metrics is available 48-96 hours after online publication and is updated daily on week days.
Initial download of the metrics may take a while.