Free Access
Fig. 4
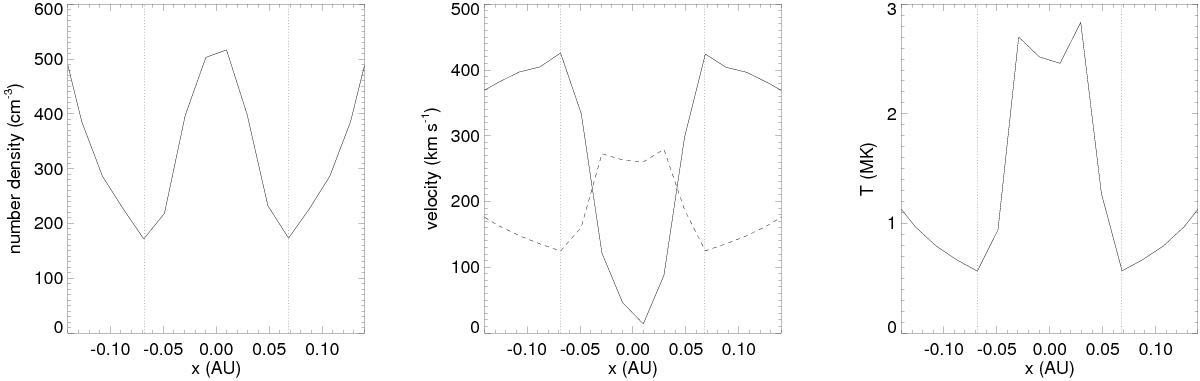
Particle number density (left panel), velocity (middle panel), and temperature (right panel) along the line-of-centres directly between the two stars (see Fig. 1). The dashed line in the velocity plot shows the sound speed along the line. The vertical dotted lines represent approximately the locations of the two shocks.
Current usage metrics show cumulative count of Article Views (full-text article views including HTML views, PDF and ePub downloads, according to the available data) and Abstracts Views on Vision4Press platform.
Data correspond to usage on the plateform after 2015. The current usage metrics is available 48-96 hours after online publication and is updated daily on week days.
Initial download of the metrics may take a while.