Fig. 3
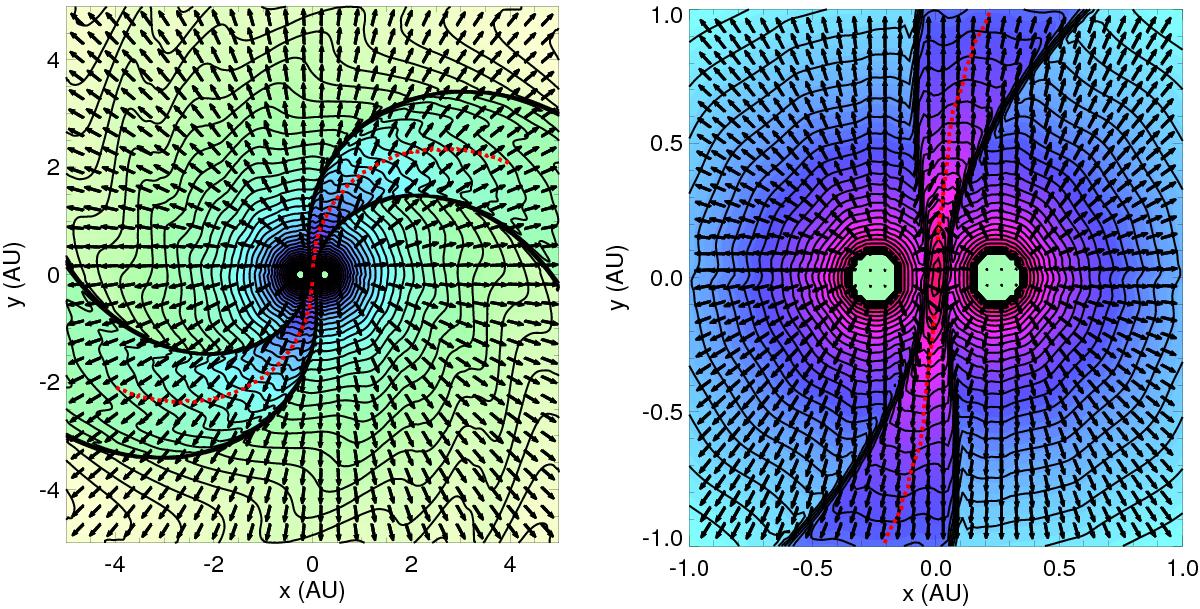
Cuts in the xy-plane showing results for the hydrodynamic binary wind simulation for the entire domain (left panel) and for the region close to the star (right panel). The background colour and the contour lines show density contours and the arrows show the direction and speed of the plasma in the inertial frame of reference. The dashed red line traces the centre of the WWC region.
Current usage metrics show cumulative count of Article Views (full-text article views including HTML views, PDF and ePub downloads, according to the available data) and Abstracts Views on Vision4Press platform.
Data correspond to usage on the plateform after 2015. The current usage metrics is available 48-96 hours after online publication and is updated daily on week days.
Initial download of the metrics may take a while.