Fig. 2
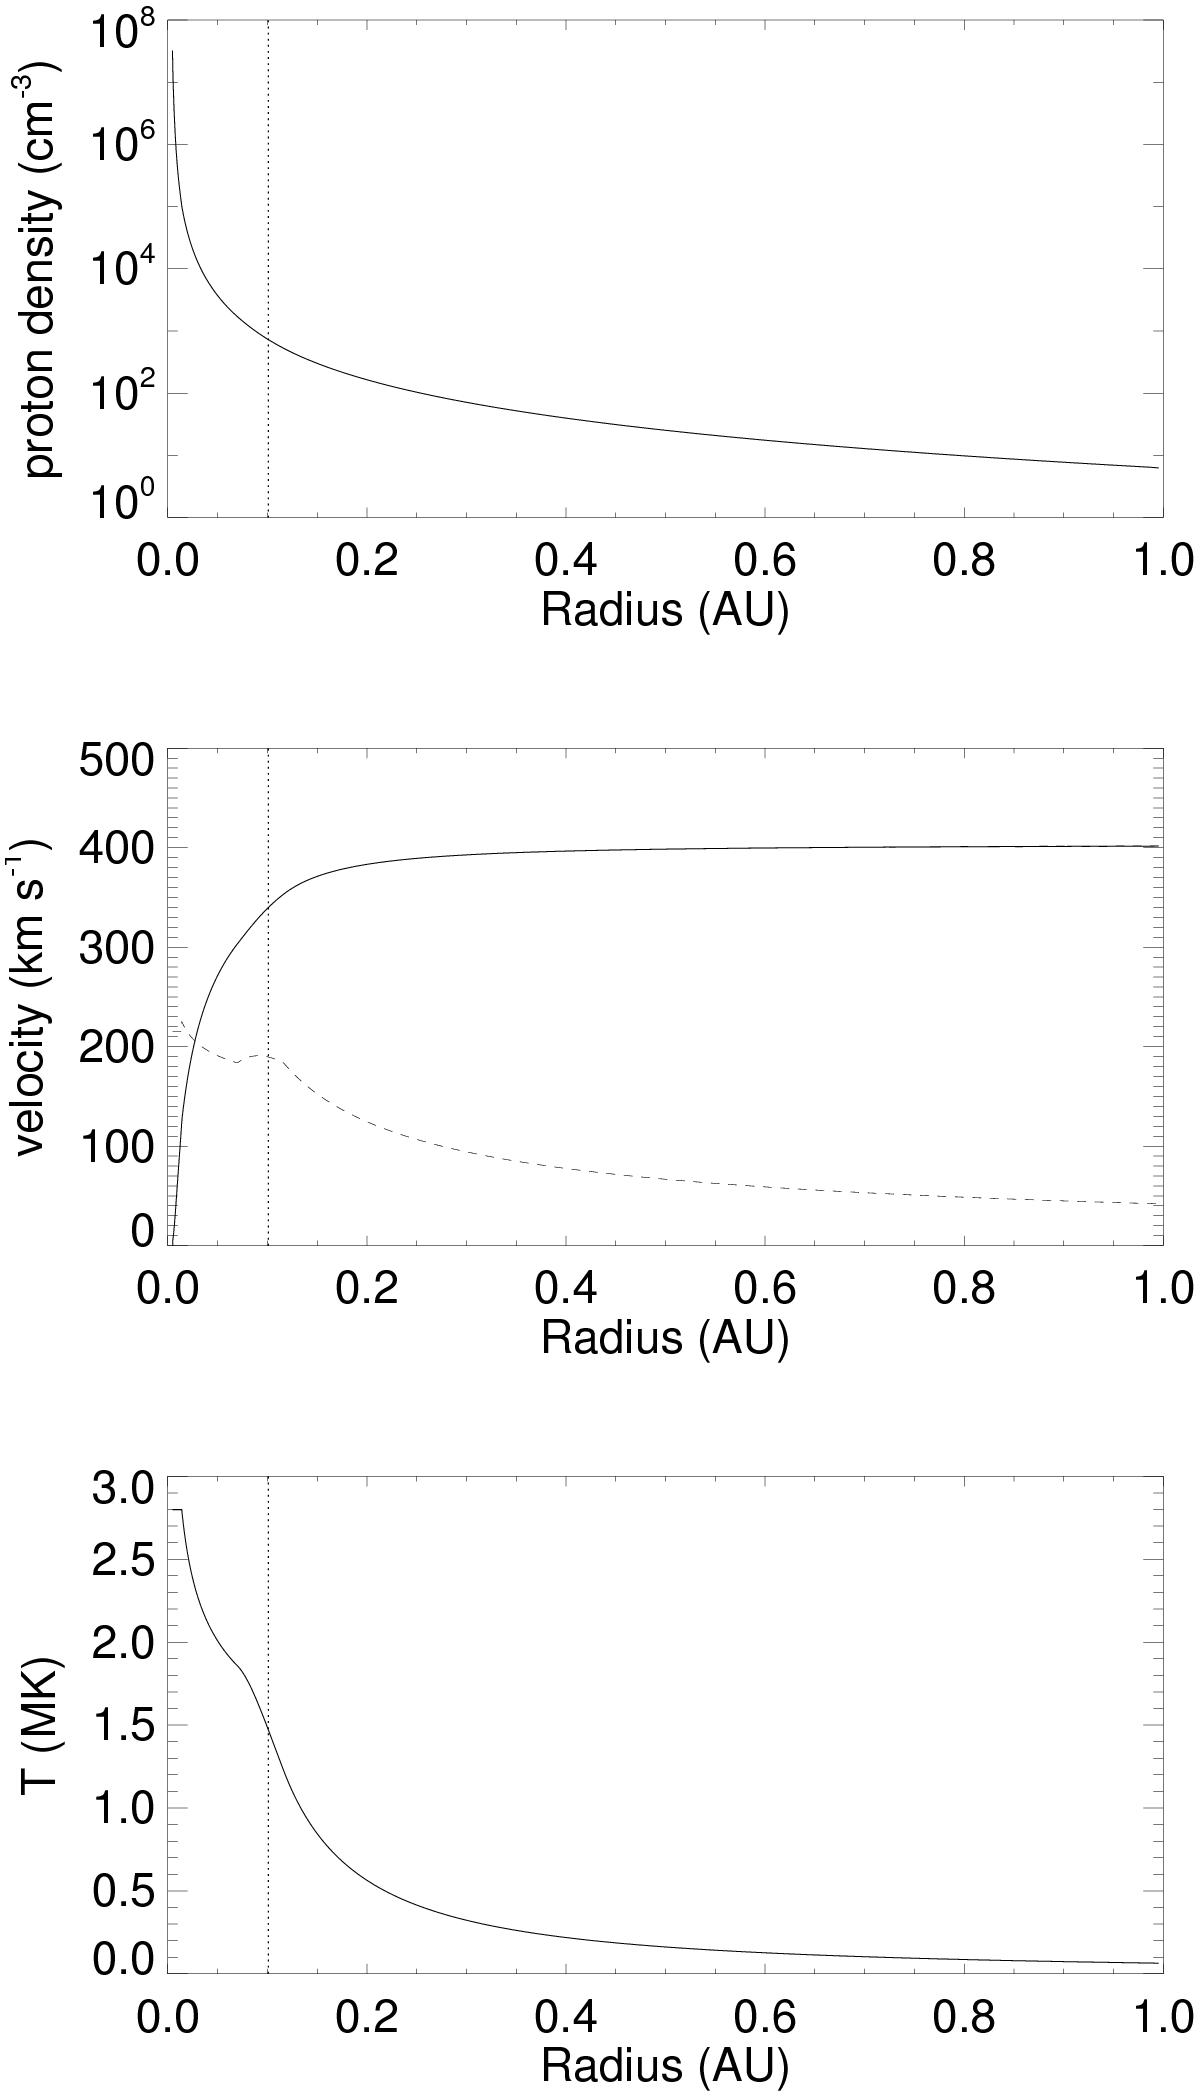
Our 1D hydrodynamical model for the slow solar wind used to derive the inner boundary conditions for our binary wind simulation. From top to bottom, the plots show particle number density, velocity, and temperature in the wind against distance from the central star. The dashed line in the velocity plot shows the sound speed as a function of radius. The vertical dotted lines in each plot show the location of 0.1 AU, which is where we take the values for the inner boundary condition in the binary wind simulation.
Current usage metrics show cumulative count of Article Views (full-text article views including HTML views, PDF and ePub downloads, according to the available data) and Abstracts Views on Vision4Press platform.
Data correspond to usage on the plateform after 2015. The current usage metrics is available 48-96 hours after online publication and is updated daily on week days.
Initial download of the metrics may take a while.