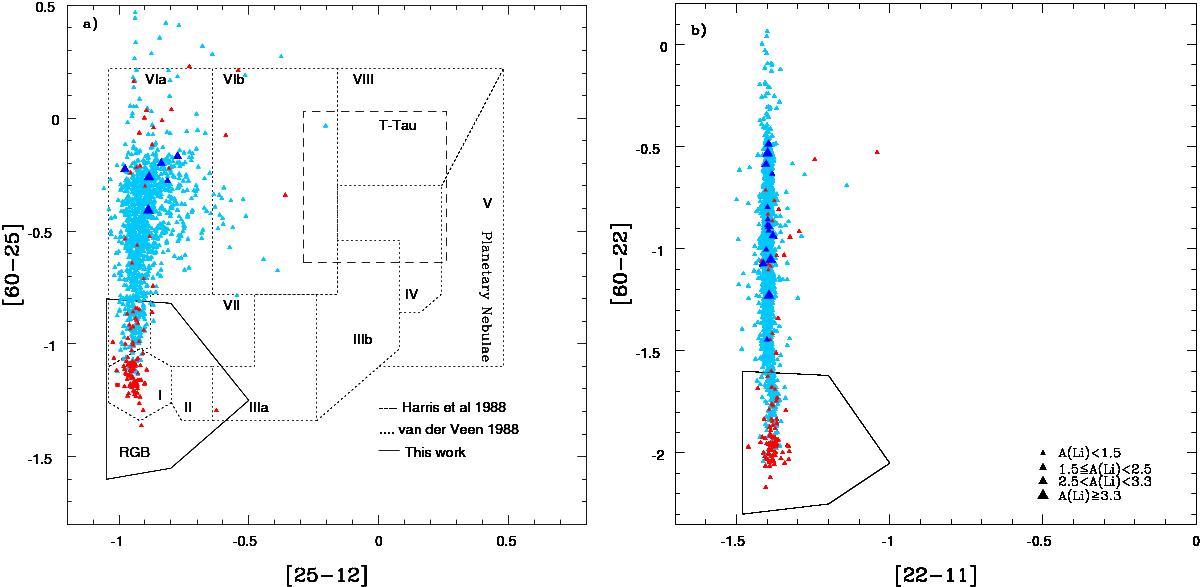
Fig. 2

Sample stars (triangles) shown in FIR color–color diagram. Red and blue colors indicate good and moderate data, respectively. Boxes with dotted lines in Fig. 2a show different phases of dust shell evolution based on the IRAS colors. The box with a dashed line represents a region of young T Tauri stars (Harris et al. 1988). The box with a solid line in both Figs. 2a and b represents the region of RGB stars. Also, shown is Arcturus, a typical K giant (red square). In Fig. 2b, the sample is plotted using WISE 11.6 μ and 22.1 μ and IRAS 60 μ flux densities.
Current usage metrics show cumulative count of Article Views (full-text article views including HTML views, PDF and ePub downloads, according to the available data) and Abstracts Views on Vision4Press platform.
Data correspond to usage on the plateform after 2015. The current usage metrics is available 48-96 hours after online publication and is updated daily on week days.
Initial download of the metrics may take a while.


