Fig. 7
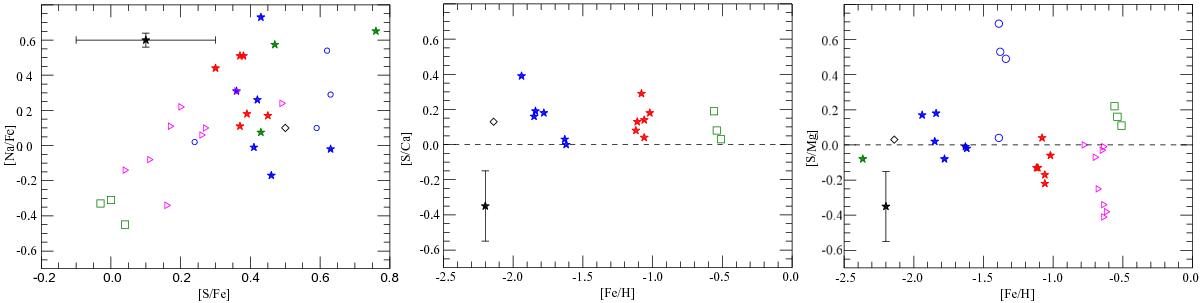
Comparison of the S abundances with the abundances of other light and α elements in GCs: [S/Fe] vs. [Na/Fe] (left panel); [Fe/H] vs. [S/Ca] (middle panel); [Fe/H] vs. [S/Mg] (right panel). Different symbols indicate stars from different clusters as indicated in the legend of Fig. 6. The maximum systematic errors are also indicated.
Current usage metrics show cumulative count of Article Views (full-text article views including HTML views, PDF and ePub downloads, according to the available data) and Abstracts Views on Vision4Press platform.
Data correspond to usage on the plateform after 2015. The current usage metrics is available 48-96 hours after online publication and is updated daily on week days.
Initial download of the metrics may take a while.