Free Access
Fig. 1
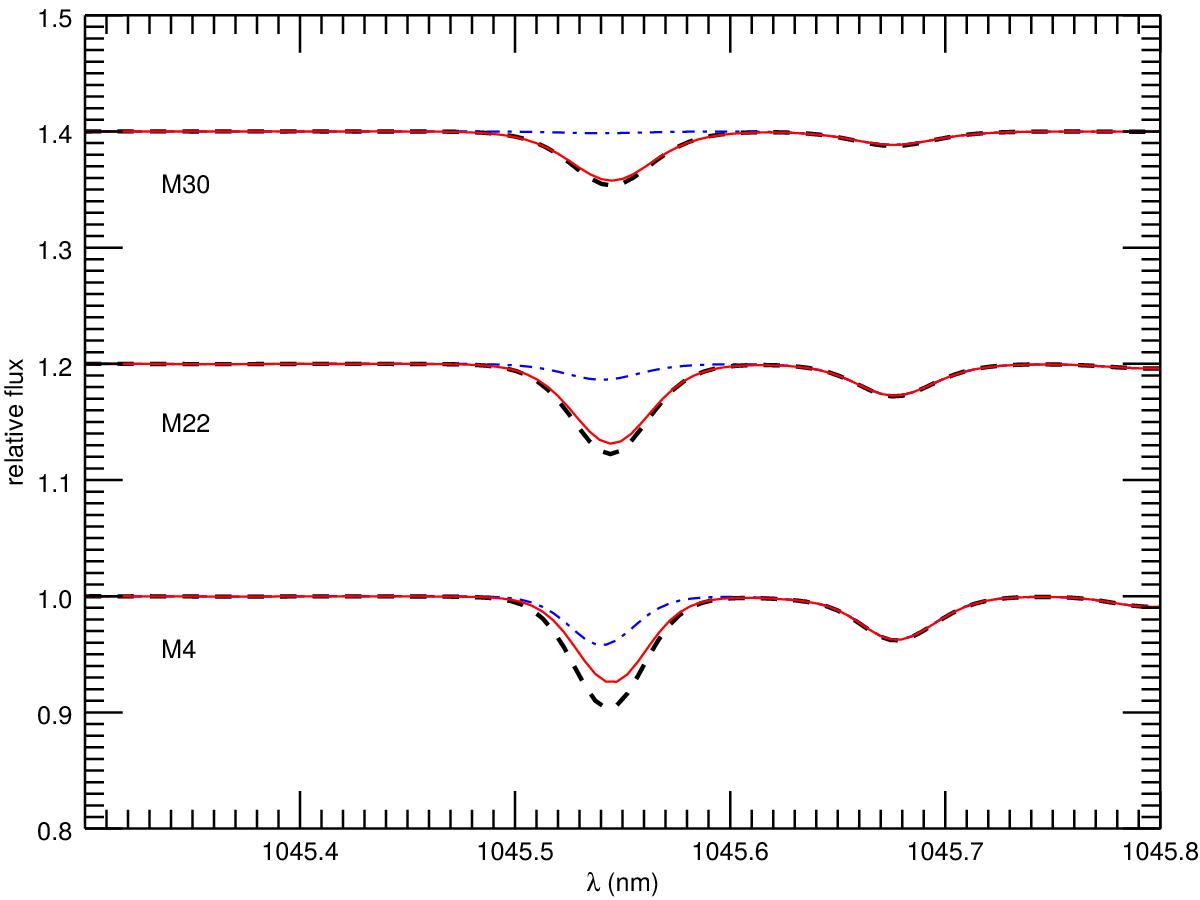
Synthetic spectra illustrating the relative contribution of the Fe I line (blue dashed-dotted line) at 1045.5 nm to the S I line at the same wavelength (red line) with respect to the combined spectral feature (thick dashed black line) at the metallicities of the three GCs assuming a solar abundance mix.
Current usage metrics show cumulative count of Article Views (full-text article views including HTML views, PDF and ePub downloads, according to the available data) and Abstracts Views on Vision4Press platform.
Data correspond to usage on the plateform after 2015. The current usage metrics is available 48-96 hours after online publication and is updated daily on week days.
Initial download of the metrics may take a while.