Fig. 6
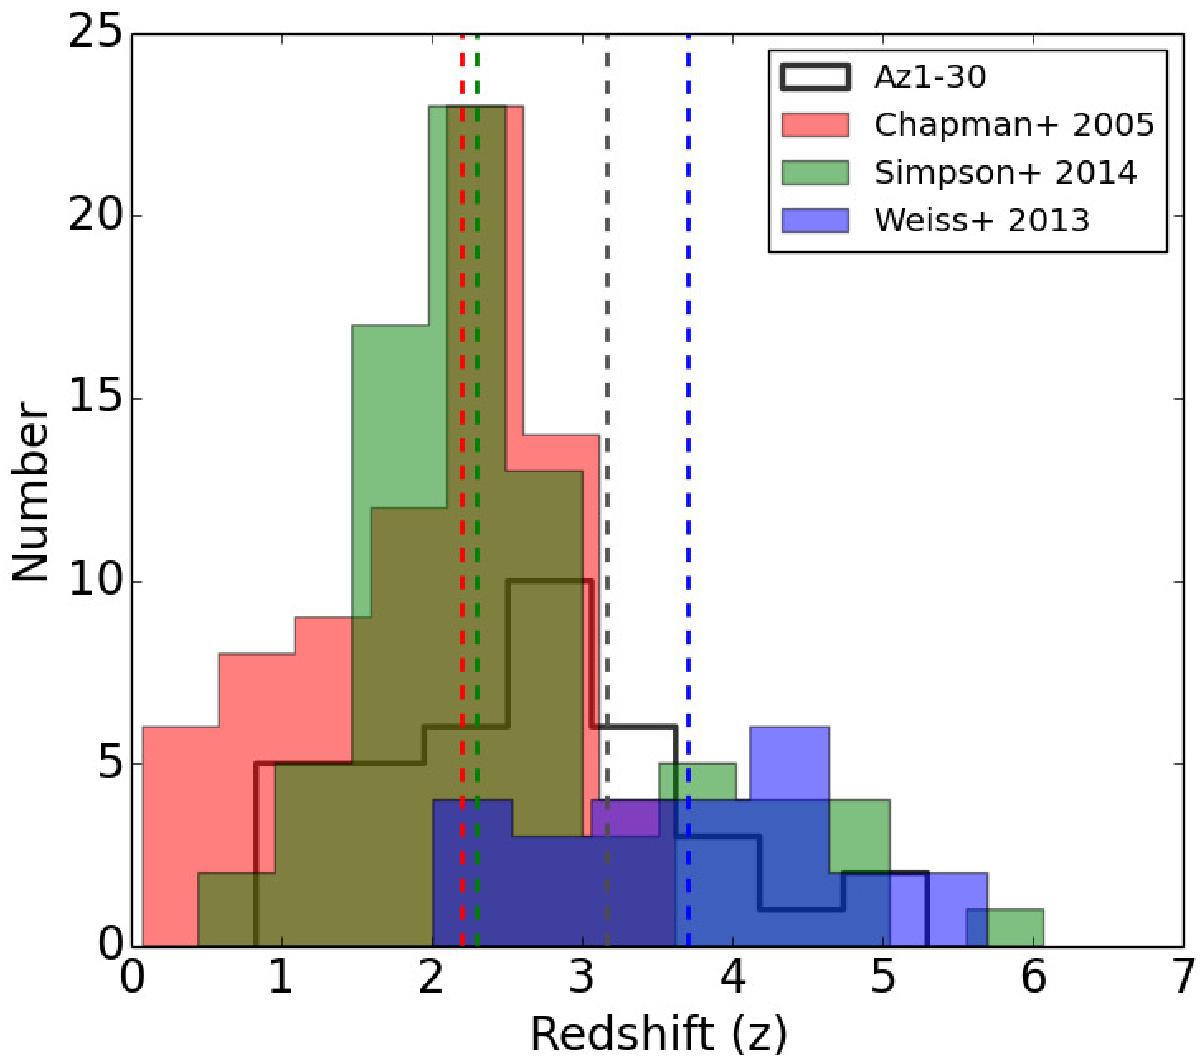
SMG redshift distributions discussed in the text. Besides our result for AzTEC1−30, the plot shows the z distributions for the radio-identified SCUBA SMGs from Chapman et al. (2005), ALESS SMGs from Simpson et al. (2014), and SPT SMGs from Weiß et al. (2013). The vertical dashed lines show the corresponding median redshifts (![]() for AzTEC1−30,
for AzTEC1−30, ![]() for the Chapman et al. 2005 SMGs,
for the Chapman et al. 2005 SMGs, ![]() for the ALESS SMGs, and
for the ALESS SMGs, and ![]() for the SPT SMGs).
for the SPT SMGs).
Current usage metrics show cumulative count of Article Views (full-text article views including HTML views, PDF and ePub downloads, according to the available data) and Abstracts Views on Vision4Press platform.
Data correspond to usage on the plateform after 2015. The current usage metrics is available 48-96 hours after online publication and is updated daily on week days.
Initial download of the metrics may take a while.